
|
Avaliação DCF da Corporação Tri-Continental (TY) |
Totalmente Editável: Adapte-Se Às Suas Necessidades No Excel Ou Planilhas
Design Profissional: Modelos Confiáveis E Padrão Da Indústria
Pré-Construídos Para Uso Rápido E Eficiente
Compatível com MAC/PC, totalmente desbloqueado
Não É Necessária Experiência; Fácil De Seguir
Tri-Continental Corporation (TY) Bundle
Avalie as perspectivas financeiras da Tri-Continental Corporation (TY) como um especialista! Essa calculadora DCF (TY) vem com dados financeiros pré-preenchidos e oferece a flexibilidade para modificar o crescimento da receita, WACC, margens e outras suposições essenciais para se alinhar às suas projeções.
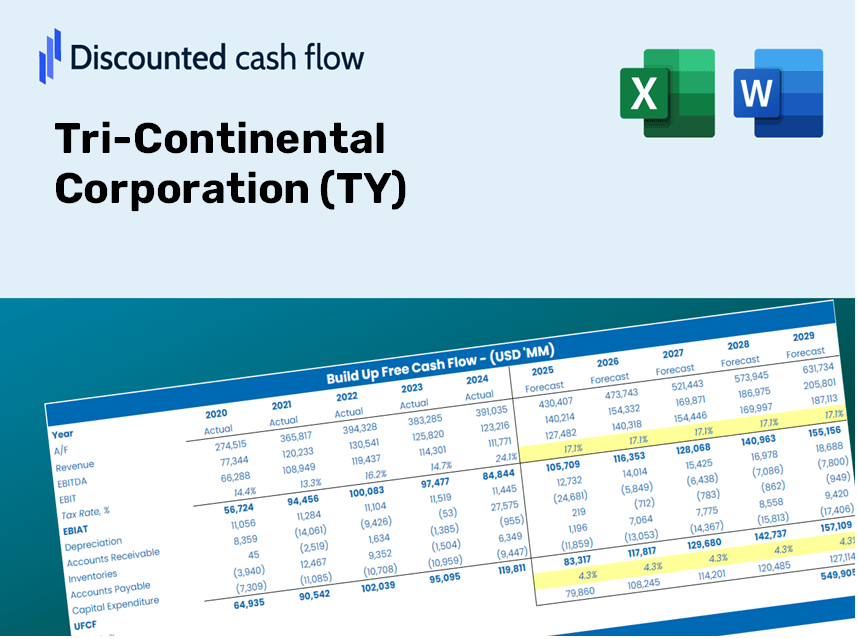
Discounted Cash Flow (DCF) - (USD MM)
| Year | AY1 2020 |
AY2 2021 |
AY3 2022 |
AY4 2023 |
AY5 2024 |
FY1 2025 |
FY2 2026 |
FY3 2027 |
FY4 2028 |
FY5 2029 |
|---|---|---|---|---|---|---|---|---|---|---|
| Revenue | 199.0 | 436.7 | -291.4 | 253.9 | 321.7 | 262.7 | 214.6 | 175.2 | 143.1 | 116.9 |
| Revenue Growth, % | 0 | 119.44 | -166.73 | -187.14 | 26.68 | -18.33 | -18.33 | -18.33 | -18.33 | -18.33 |
| EBITDA | 198.0 | 435.7 | -292.2 | 253.1 | 320.7 | 262.0 | 214.0 | 174.8 | 142.7 | 116.6 |
| EBITDA, % | 99.48 | 99.78 | 100.28 | 99.67 | 99.72 | 99.73 | 99.73 | 99.73 | 99.73 | 99.73 |
| Depreciation | .0 | .0 | .0 | .0 | .0 | .0 | .0 | .0 | .0 | .0 |
| Depreciation, % | 0 | 0 | 0 | 0 | 0 | 0 | 0 | 0 | 0 | 0 |
| EBIT | 198.0 | 435.7 | -292.2 | 253.1 | 320.7 | 262.0 | 214.0 | 174.8 | 142.7 | 116.6 |
| EBIT, % | 99.48 | 99.78 | 100.28 | 99.67 | 99.72 | 99.73 | 99.73 | 99.73 | 99.73 | 99.73 |
| Total Cash | .1 | .0 | .0 | .0 | .0 | .0 | .0 | .0 | .0 | .0 |
| Total Cash, percent | .0 | .0 | .0 | .0 | .0 | .0 | .0 | .0 | .0 | .0 |
| Account Receivables | 9.8 | 8.3 | 9.7 | 17.8 | 10.7 | 7.3 | 5.9 | 4.9 | 4.0 | 3.2 |
| Account Receivables, % | 4.93 | 1.91 | -3.34 | 7.03 | 3.34 | 2.77 | 2.77 | 2.77 | 2.77 | 2.77 |
| Inventories | .0 | .0 | .0 | .0 | .0 | .0 | .0 | .0 | .0 | .0 |
| Inventories, % | 0 | 0 | 0 | 0 | 0 | 0 | 0 | 0 | 0 | 0 |
| Accounts Payable | 1.7 | 1.6 | 1.2 | 4.0 | 2.8 | 1.7 | 1.4 | 1.1 | .9 | .8 |
| Accounts Payable, % | 0.84515 | 0.3778 | -0.40626 | 1.58 | 0.85619 | 0.64994 | 0.64994 | 0.64994 | 0.64994 | 0.64994 |
| Capital Expenditure | .0 | .0 | .0 | .0 | .0 | .0 | .0 | .0 | .0 | .0 |
| Capital Expenditure, % | 0 | 0 | 0 | 0 | 0 | 0 | 0 | 0 | 0 | 0 |
| Tax Rate, % | 0 | 0 | 0 | 0 | 0 | 0 | 0 | 0 | 0 | 0 |
| EBITAT | 198.0 | 435.7 | -292.2 | 253.1 | 320.7 | 262.0 | 214.0 | 174.8 | 142.7 | 116.6 |
| Depreciation | ||||||||||
| Changes in Account Receivables | ||||||||||
| Changes in Inventories | ||||||||||
| Changes in Accounts Payable | ||||||||||
| Capital Expenditure | ||||||||||
| UFCF | 189.8 | 437.2 | -294.1 | 247.8 | 326.6 | 264.4 | 215.0 | 175.6 | 143.4 | 117.1 |
| WACC, % | 7.78 | 7.78 | 7.78 | 7.78 | 7.78 | 7.78 | 7.78 | 7.78 | 7.78 | 7.78 |
| PV UFCF | ||||||||||
| SUM PV UFCF | 757.5 | |||||||||
| Long Term Growth Rate, % | 0.50 | |||||||||
| Free cash flow (T + 1) | 118 | |||||||||
| Terminal Value | 1,618 | |||||||||
| Present Terminal Value | 1,113 | |||||||||
| Enterprise Value | 1,870 | |||||||||
| Net Debt | 0 | |||||||||
| Equity Value | 1,870 | |||||||||
| Diluted Shares Outstanding, MM | 52 | |||||||||
| Equity Value Per Share | 36.21 |
Benefits of Choosing Tri-Continental Corporation (TY)
- Comprehensive Financial Model: Leverage Tri-Continental's actual financials for accurate DCF valuation.
- Complete Forecast Customization: Modify growth rates, profit margins, WACC, and other essential metrics.
- Real-Time Calculations: Immediate updates provide instant visibility of results as adjustments are made.
- Professional-Grade Template: A polished Excel workbook crafted for high-quality valuations.
- Flexible and Reusable: Specifically designed for adaptability, allowing for repeated use in detailed financial projections.
Key Features of Tri-Continental Corporation (TY)
- Customizable Financial Inputs: Adjust vital metrics such as revenue growth, EBITDA %, and capital expenditures to suit your analysis.
- Instant DCF Valuation: Automatically computes intrinsic value, NPV, and additional metrics in real-time.
- High Precision Results: Leverages Tri-Continental's actual financial data for accurate valuation insights.
- Effortless Scenario Testing: Easily assess various assumptions and evaluate their impacts on outcomes.
- Efficiency Enhancer: Streamline your valuation process without the hassle of constructing intricate models from the ground up.
How It Operates
- 1. Access the Template: Download and open the Excel file containing Tri-Continental Corporation’s (TY) preloaded data.
- 2. Modify Assumptions: Update essential inputs such as growth rates, WACC, and capital expenditures.
- 3. Instant Results: The DCF model automatically calculates intrinsic value and NPV in real-time.
- 4. Explore Scenarios: Evaluate various forecasts to examine different valuation results.
- 5. Present with Assurance: Deliver professional valuation insights to enhance your decision-making.
Why Opt for the Tri-Continental Calculator?
- Precision: Leverages actual Tri-Continental Corporation (TY) financials for dependable data accuracy.
- Versatility: Tailored for users to freely experiment with and adjust inputs.
- Efficiency: Bypass the complexities of constructing a DCF model from the ground up.
- Expert-Grade: Crafted with the level of detail and usability typically expected by CFOs.
- Intuitive: Designed for ease of use, even for those lacking deep financial modeling knowledge.
Who Can Benefit from Tri-Continental Corporation (TY)?
- Investors: Make informed investment choices with an advanced valuation tool.
- Financial Analysts: Streamline your analysis process with a customizable DCF model at your disposal.
- Consultants: Effortlessly modify the template for client reports or presentations.
- Finance Enthusiasts: Enhance your grasp of valuation methods through practical, real-world examples.
- Educators and Students: Utilize it as an effective resource for finance education and coursework.
What the Template Includes
- Pre-Filled Data: Contains Tri-Continental Corporation's historical financials and projections.
- Discounted Cash Flow Model: Editable DCF valuation model featuring automatic calculations.
- Weighted Average Cost of Capital (WACC): A dedicated sheet for calculating WACC based on user-defined inputs.
- Key Financial Ratios: Assess Tri-Continental Corporation's profitability, efficiency, and leverage metrics.
- Customizable Inputs: Easily modify revenue growth, profit margins, and tax rates.
- Clear Dashboard: Visualizations and tables summarizing essential valuation outcomes.
Disclaimer
All information, articles, and product details provided on this website are for general informational and educational purposes only. We do not claim any ownership over, nor do we intend to infringe upon, any trademarks, copyrights, logos, brand names, or other intellectual property mentioned or depicted on this site. Such intellectual property remains the property of its respective owners, and any references here are made solely for identification or informational purposes, without implying any affiliation, endorsement, or partnership.
We make no representations or warranties, express or implied, regarding the accuracy, completeness, or suitability of any content or products presented. Nothing on this website should be construed as legal, tax, investment, financial, medical, or other professional advice. In addition, no part of this site—including articles or product references—constitutes a solicitation, recommendation, endorsement, advertisement, or offer to buy or sell any securities, franchises, or other financial instruments, particularly in jurisdictions where such activity would be unlawful.
All content is of a general nature and may not address the specific circumstances of any individual or entity. It is not a substitute for professional advice or services. Any actions you take based on the information provided here are strictly at your own risk. You accept full responsibility for any decisions or outcomes arising from your use of this website and agree to release us from any liability in connection with your use of, or reliance upon, the content or products found herein.