
|
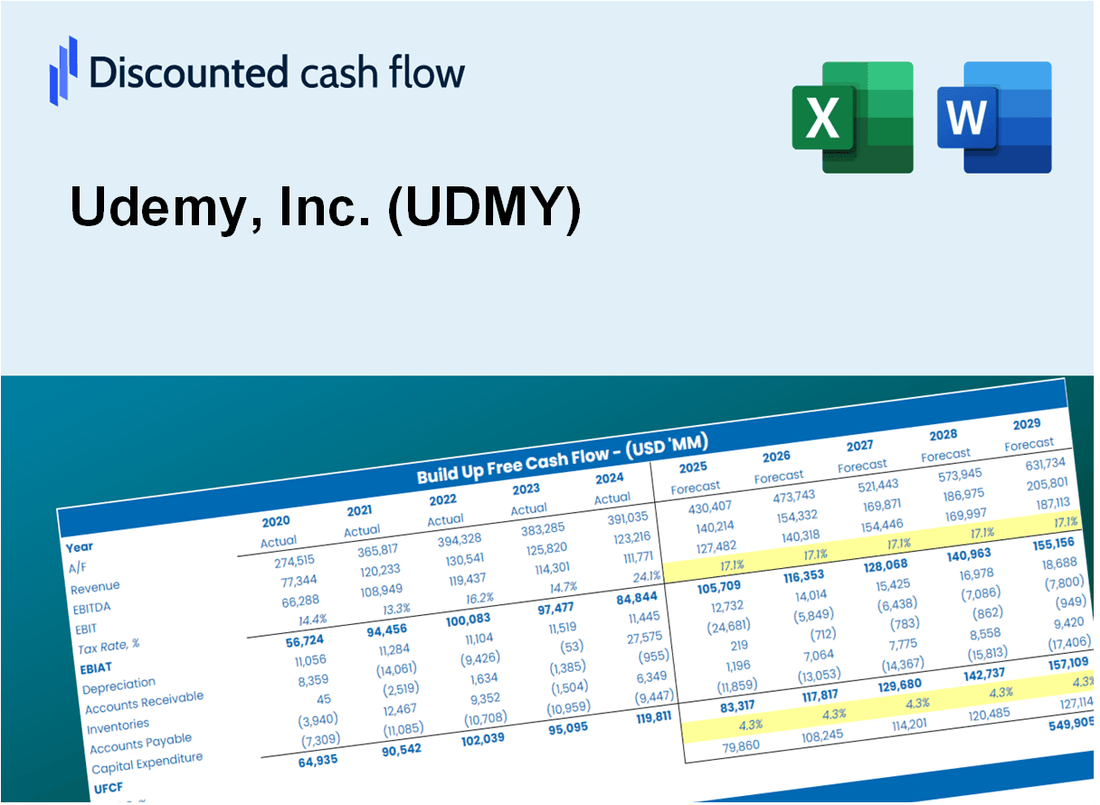
Udemy, Inc. (UDMY) Avaliação DCF |
Totalmente Editável: Adapte-Se Às Suas Necessidades No Excel Ou Planilhas
Design Profissional: Modelos Confiáveis E Padrão Da Indústria
Pré-Construídos Para Uso Rápido E Eficiente
Compatível com MAC/PC, totalmente desbloqueado
Não É Necessária Experiência; Fácil De Seguir
Udemy, Inc. (UDMY) Bundle
Explore Udemy, Inc. (UDMY) Outlook financeiro com nossa calculadora DCF amigável! Digite suas projeções de crescimento, margens de lucro e despesas para calcular o valor intrínseco da UDemy, Inc. (UDMY) e moldar suas decisões de investimento.
What You Will Get
- Editable Course Inputs: Easily modify assumptions (enrollment rates, course prices, growth %) to explore various outcomes.
- Real-World Data: Udemy’s financial metrics pre-filled to kickstart your analysis.
- Automatic Revenue Outputs: The template computes projected revenue and profitability for you.
- Customizable and Professional: A sleek Excel model tailored to meet your valuation requirements.
- Built for Educators and Investors: Perfect for evaluating course performance, validating strategies, and enhancing efficiency.
Key Features
- 🔍 Real-Life UDMY Financials: Pre-filled historical and projected data for Udemy, Inc. (UDMY).
- ✏️ Fully Customizable Inputs: Adjust all critical parameters (yellow cells) like WACC, growth %, and tax rates.
- 📊 Professional DCF Valuation: Built-in formulas calculate Udemy’s intrinsic value using the Discounted Cash Flow method.
- ⚡ Instant Results: Visualize Udemy’s valuation instantly after making changes.
- Scenario Analysis: Test and compare outcomes for various financial assumptions side-by-side.
How It Works
- Step 1: Download the Excel file.
- Step 2: Review Udemy’s pre-filled financial data and forecasts.
- Step 3: Modify key inputs such as course enrollment growth, marketing expenses, and subscription rates (highlighted cells).
- Step 4: Observe the DCF model update in real-time as you adjust your assumptions.
- Step 5: Evaluate the outputs and leverage the results for your investment strategies.
Why Choose This Udemy Calculator?
- Accuracy: Reliable Udemy financials guarantee precise data.
- Flexibility: Built for users to experiment and adjust inputs effortlessly.
- Time-Saving: Eliminate the need to create a financial model from the ground up.
- Professional-Grade: Crafted with CFO-level accuracy and user experience in focus.
- User-Friendly: Intuitive interface suitable for users without extensive financial modeling skills.
Who Should Use This Product?
- Students: Enhance your learning experience with a wide range of courses and resources.
- Professionals: Upskill and stay competitive in the job market by acquiring new knowledge.
- Instructors: Create and share your expertise with a global audience through course creation.
- Employers: Invest in employee development by providing access to valuable training materials.
- Education Institutions: Incorporate online learning into curricula to enrich student education.
What the Template Contains
- Pre-Filled DCF Model: Udemy’s financial data preloaded for immediate use.
- WACC Calculator: Detailed calculations for Weighted Average Cost of Capital.
- Financial Ratios: Evaluate Udemy’s profitability, leverage, and efficiency.
- Editable Inputs: Change assumptions such as growth, margins, and CAPEX to fit your scenarios.
- Financial Statements: Annual and quarterly reports to support detailed analysis.
- Interactive Dashboard: Easily visualize key valuation metrics and results.
Disclaimer
All information, articles, and product details provided on this website are for general informational and educational purposes only. We do not claim any ownership over, nor do we intend to infringe upon, any trademarks, copyrights, logos, brand names, or other intellectual property mentioned or depicted on this site. Such intellectual property remains the property of its respective owners, and any references here are made solely for identification or informational purposes, without implying any affiliation, endorsement, or partnership.
We make no representations or warranties, express or implied, regarding the accuracy, completeness, or suitability of any content or products presented. Nothing on this website should be construed as legal, tax, investment, financial, medical, or other professional advice. In addition, no part of this site—including articles or product references—constitutes a solicitation, recommendation, endorsement, advertisement, or offer to buy or sell any securities, franchises, or other financial instruments, particularly in jurisdictions where such activity would be unlawful.
All content is of a general nature and may not address the specific circumstances of any individual or entity. It is not a substitute for professional advice or services. Any actions you take based on the information provided here are strictly at your own risk. You accept full responsibility for any decisions or outcomes arising from your use of this website and agree to release us from any liability in connection with your use of, or reliance upon, the content or products found herein.