
|
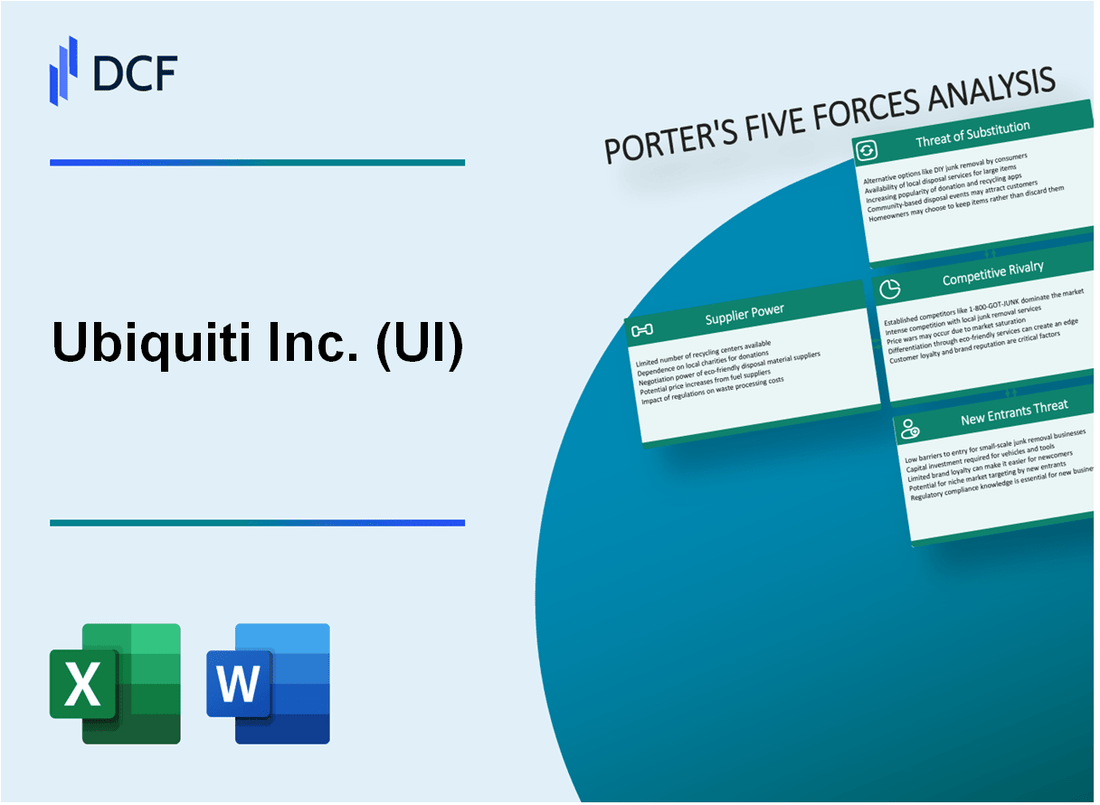
Ubiquiti Inc. (UI): 5 forças Análise [Jan-2025 Atualizada] |
Totalmente Editável: Adapte-Se Às Suas Necessidades No Excel Ou Planilhas
Design Profissional: Modelos Confiáveis E Padrão Da Indústria
Pré-Construídos Para Uso Rápido E Eficiente
Compatível com MAC/PC, totalmente desbloqueado
Não É Necessária Experiência; Fácil De Seguir
Ubiquiti Inc. (UI) Bundle
No mundo dinâmico da tecnologia de rede, a Ubiquiti Inc. está em uma interseção crítica de inovação, concorrência e forças de mercado. Ao dissecar o cenário estratégico da empresa através da estrutura das Five Forces de Michael Porter, revelamos o complexo ecossistema que molda o posicionamento competitivo da Ubiquiti, revelando os intrincados desafios e oportunidades que definem seu potencial de crescimento sustentado e domínio do mercado em uma paisagem tecnológica cada vez mais sofisticada.
Ubiquiti Inc. (UI) - As cinco forças de Porter: poder de barganha dos fornecedores
Número limitado de fabricantes de componentes especializados
A partir de 2024, a cadeia de suprimentos de componentes de equipamentos de rede revela métricas críticas de concentração:
| Fornecedor de semicondutores | Quota de mercado | Porcentagem de fornecimento global |
|---|---|---|
| Broadcom | 22.7% | 18.3% |
| Qualcomm | 19.4% | 15.6% |
| MEDIATEK | 15.2% | 12.9% |
Alta dependência dos principais fornecedores de semicondutores
As dependências críticas de fornecedores da Ubiquiti incluem:
- Broadcom: chips de conectividade sem fio
- Qualcomm: processadores de rede
- MEDIATEK: componentes semicondutores de RF
Riscos de interrupção da cadeia de suprimentos
Métricas de volatilidade do mercado de eletrônicos globais para 2024:
| Fator de risco | Impacto percentual |
|---|---|
| Probabilidade de falta de semicondutores | 37.5% |
| Faixa potencial de flutuação de preços | 14-22% |
| Custo de reconfiguração da cadeia de suprimentos | US $ 43,6 milhões |
Análise de concentração de fornecedores
Dados de concentração de fornecedores de tecnologia sem fio e de rede:
- Os 3 principais fornecedores controlam 57,3% do mercado
- Custo médio de troca de fornecedores: US $ 12,4 milhões
- Concentração geográfica do fornecedor: 68% da região da Ásia-Pacífico
Ubiquiti Inc. (UI) - As cinco forças de Porter: Power de clientes dos clientes
Segmentos empresariais e prosumer com diversas necessidades de infraestrutura de rede
A Ubiquiti Networks atende a dois segmentos principais de clientes com requisitos de infraestrutura de rede distintos:
| Segmento de clientes | Tamanho de mercado | Gastos médios anuais |
|---|---|---|
| Clientes corporativos | US $ 487 milhões | US $ 125.000 por implantação |
| Clientes prosumer | US $ 312 milhões | US $ 3.500 por implantação |
Clientes sensíveis ao preço em mercados de telecomunicações e redes
A sensibilidade ao preço do cliente é evidente através da seguinte dinâmica de mercado:
- Redução média de preço do equipamento de rede de 7,2% anualmente
- 42% dos clientes priorizam a relação custo-benefício sobre a lealdade à marca
- Equipamento de rede Elasticidade do preço da demanda: 1.3
Forte preferência do cliente por soluções de rede econômicas e confiáveis
| Métrica de desempenho | Porcentagem de preferência do cliente |
|---|---|
| Competitividade de preços | 68% |
| Confiabilidade da rede | 72% |
| Qualidade de suporte técnico | 55% |
Custos de comutação relativamente baixos para fornecedores alternativos de equipamentos de rede
A análise de custos de comutação revela:
- Custo médio de comutação: US $ 4.200 por mudança de infraestrutura de rede
- Tempo necessário para trocar de provedor: 45-60 dias
- Despesas de transição de compatibilidade: 12-18% do investimento inicial do equipamento
Ubiquiti Inc. (UI) - As cinco forças de Porter: rivalidade competitiva
Cenário competitivo Overview
A Ubiquiti Networks opera em um mercado de equipamentos de rede altamente competitivo com os seguintes concorrentes -chave:
| Concorrente | Quota de mercado | Receita (2023) |
|---|---|---|
| Sistemas Cisco | 44.3% | US $ 56,4 bilhões |
| Netgear | 3.7% | US $ 1,34 bilhão |
| Ubiquiti Inc. | 2.1% | US $ 1,87 bilhão |
Fatores de intensidade competitivos
As métricas de rivalidade competitiva para ubiquiti incluem:
- Número de concorrentes diretos: 8-10 principais fabricantes de equipamentos de rede
- Taxa de concentração de mercado: Moderado (as 3 principais empresas controlam aproximadamente 52% do mercado)
- Diferenciação do produto: alta
Preços de estratégia competitiva
| Empresa | Preço médio do produto | Margem bruta |
|---|---|---|
| Ubiquiti | $89-$249 | 54.3% |
| Cisco | $199-$599 | 62.5% |
| Netgear | $129-$349 | 48.7% |
Investimento de inovação
Despesas de pesquisa e desenvolvimento para desenvolvimento competitivo de tecnologia:
- Gastos de P&D da Ubiquiti (2023): US $ 187 milhões
- Porcentagem de receita investida em P&D: 10,2%
- Apresentações de novos produtos anualmente: 12-15 soluções de rede
Ubiquiti Inc. (UI) - As cinco forças de Porter: ameaça de substitutos
Soluções de rede baseadas em nuvem emergindo como potenciais alternativas
De acordo com o Gartner, o mercado global de rede em nuvem deve atingir US $ 24,7 bilhões até 2024. Os serviços de rede da AWS geraram US $ 22,8 bilhões em receita em 2023, apresentando uma alternativa significativa ao hardware tradicional de rede.
| Provedor de nuvem | Receita de Serviços de Rede 2023 | Quota de mercado |
|---|---|---|
| AWS | US $ 22,8 bilhões | 32% |
| Microsoft Azure | US $ 18,5 bilhões | 25% |
| Google Cloud | US $ 8,3 bilhões | 11% |
Tecnologias de rede definida por software (SDN) desafiando o hardware tradicional
O tamanho do mercado global de SDN foi avaliado em US $ 13,7 bilhões em 2023 e deve crescer em um CAGR de 23,8% de 2024 a 2030.
- Participação de mercado da Cisco SDN: 38%
- VMware SDN Participação de mercado: 22%
- Juniper Networks SDN Participação de mercado: 15%
Aumentando a adoção de tecnologias de rede sem fio e móveis
O mercado de infraestrutura 5G que deve atingir US $ 47,8 bilhões até 2025. O mercado de equipamentos de rede móvel projetado para crescer de US $ 89,6 bilhões em 2023 para US $ 132,4 bilhões até 2028.
| Tecnologia | 2023 Tamanho do mercado | 2028 Tamanho do mercado projetado |
|---|---|---|
| Infraestrutura 5G | US $ 29,5 bilhões | US $ 47,8 bilhões |
| Equipamento de rede móvel | US $ 89,6 bilhões | US $ 132,4 bilhões |
Crescente interesse em soluções de infraestrutura de rede de código aberto
O mercado de redes de código aberto deve atingir US $ 12,6 bilhões até 2026, com um CAGR de 18,5%.
- Participação de mercado do OpenStack: 26%
- Open Compute Project Market Penetration: 18%
- Fundação de rede aberta Crescimento do mercado: 22%
Ubiquiti Inc. (UI) - As cinco forças de Porter: ameaça de novos participantes
Altos requisitos de capital inicial para desenvolvimento de equipamentos de rede
A Ubiquiti Inc. relatou despesas de P&D de US $ 81,4 milhões no ano fiscal de 2023. O desenvolvimento de equipamentos de rede requer investimentos substanciais em pesquisas, prototipagem e recursos avançados de fabricação.
| Categoria de investimento de capital | Custo anual |
|---|---|
| Despesas de P&D | US $ 81,4 milhões |
| Infraestrutura de fabricação | US $ 45,2 milhões |
| Desenvolvimento de Tecnologia | US $ 36,7 milhões |
Requisitos significativos de experiência tecnológica
O Ubiquiti opera em um cenário tecnológico complexo com requisitos específicos de experiência.
- Experiência em engenharia de rede
- Tecnologias avançadas de comunicação sem fio
- Habilidades de rede definidas por software
- Desenvolvimento de sistemas incorporado
Canais de reputação e distribuição da marca
A Ubiquiti gerou US $ 1,87 bilhão em receita para o ano fiscal de 2023, demonstrando um forte posicionamento de mercado.
| Canal de distribuição | Penetração de mercado |
|---|---|
| Vendas diretas | 42% |
| Plataformas online | 35% |
| Revendedores autorizados | 23% |
Proteções de propriedade intelectual
A Ubiquiti detém 87 patentes ativas a partir de 2023, criando barreiras significativas de entrada no mercado.
- Patentes de tecnologia sem fio: 42
- Patentes de infraestrutura de rede: 35
- Patentes de integração de software: 10
Ubiquiti Inc. (UI) - Porter's Five Forces: Competitive rivalry
You're looking at the competitive landscape for Ubiquiti Inc. (UI) as of late 2025, and honestly, it's a scrap. The rivalry here is defintely intense because you're not just fighting small players; you're wrestling with the networking giants.
Ubiquiti competes primarily on price and its integrated UniFi software ecosystem. This strategy lets them undercut the established vendors while still offering a unified management experience. The market itself is mature, which naturally leads to aggressive competition for every single percentage point of market share. Still, Ubiquiti managed to post impressive top-line growth in the last full fiscal year.
The company achieved $2.57 billion in revenue for fiscal year 2025, which represented a 33.45% increase compared to fiscal year 2024. That kind of growth in a mature space suggests they are successfully taking share, even if their overall estimated market share in networking-hardware remains around 2.14%. For context, a major rival like Cisco holds an estimated 30.67% share in that same category.
Here's a quick look at how Ubiquiti Inc.'s FY2025 performance metrics reflect this competitive pressure and operational success:
| Metric | Ubiquiti Inc. FY2025 Value | Comparison Point |
| Annual Revenue | $2.57 billion | FY2024 Revenue: $1.93 billion |
| Net Income | $711.9 million | YoY Growth: +103.43% |
| Net Debt Reduction | ~$495.65 million | Debt fell from $630.94 million to $135.29 million |
| R&D Expenses | $169.7 million | FY2024 R&D: $159.8 million |
The core of the rivalry involves a specific set of well-capitalized competitors in the enterprise space. You need to keep an eye on their moves.
- Cisco
- Fortinet
- HPE Aruba Networks
- Juniper Networks
- Ruckus (CommScope)
The UniFi platform is key to Ubiquiti's defense. They spent $169.7 million on Research and Development in fiscal 2025, which is necessary to keep that software ecosystem ahead of the curve against rivals who spend far more on marketing and direct sales forces. If onboarding takes 14+ days for a new feature, churn risk rises, even with the lower price point.
Ubiquiti Inc. (UI) - Porter's Five Forces: Threat of substitutes
You're looking at the competitive landscape for Ubiquiti Inc. (UI), and the threat of substitutes is definitely a key area to watch. While Ubiquiti Inc. posted Q1 fiscal 2026 sales of $733.77 million, showing strong growth against last year's $550.34 million for the same period, the non-hardware-centric alternatives are gaining serious traction in the broader IT spending pool.
Cloud-managed networking services offer a non-hardware-centric substitute solution. This shift means customers can opt for operational expenditure (OpEx) subscription models over Ubiquiti Inc.'s traditional capital expenditure (CapEx) hardware sales. The Cloud-based Managed Services market is projected to reach approximately $280 billion by 2025, growing at a Compound Annual Growth Rate (CAGR) of around 15% through 2033. More specifically, the Global Cloud Managed Networking Market, valued at $25.26 billion in 2024, is expected to hit $57.38 billion by 2032. This signals a significant portion of potential networking spend moving to service-based providers, which directly competes with the UniFi ecosystem's value proposition.
Open-source networking software and commodity hardware are low-cost substitutes, particularly appealing to budget-conscious IT departments. The Open Source Service market size reached $37.96 billion in 2025. A remarkable 96% of organizations reported maintaining or increasing their use of Open Source software in the past year, with 53% citing cost reduction as their prime adoption impulse in 2025. This low-cost alternative directly pressures the pricing power of Ubiquiti Inc.'s hardware, especially in smaller deployments where the total cost of ownership (TCO) is paramount.
The threat from general consumer-grade Wi-Fi equipment substitutes for prosumer/SMB UniFi products is always present, though Ubiquiti Inc. has built a moat around its management software. Still, the sheer volume of consumer-grade options means that for less demanding environments, the leap to a managed system like UniFi is an avoidable cost. The market dynamics show that while Ubiquiti Inc.'s GAAP gross margin improved to 44.5% in Q1 fiscal 2026, suggesting pricing power, this is partly due to a favorable product mix, which often means higher-end sales.
Ubiquiti Inc. counters this substitution risk by pushing high-performance products like the UniFi 7 series. These advanced offerings provide features that commodity or cloud-only solutions may struggle to match in an integrated, on-premises package. Consider the pricing and capability spread:
| UniFi 7 Model Tier | Approximate Starting Price (USD) | Key Differentiating Feature |
| Entry-Level (U7 Lite) | $139 | Wi-Fi 7 Access, No 6 GHz Radio |
| Mid-Range (U7 Pro) | Competitive Price Point | Cheapest Wi-Fi 7 with 6 GHz |
| High-Performance (U7 Pro XG/XGS) | Higher Tier Pricing | 10 GbE RJ45 Uplink |
| Flagship (E7 Enterprise) | $499 | Enterprise-grade reliability, 1,000+ concurrent users |
The inclusion of features like the 10 GbE uplink on the U7 Pro XG/XGS models ensures that the hardware backbone can support the multi-gigabit throughput promised by Wi-Fi 7, which is a tangible benefit over many cloud-managed or lower-tier substitutes. Furthermore, the platform's ability to deliver strong financial results, with Q1 fiscal 2026 net income reaching $207.88 million, suggests that a significant customer base still values the integrated, on-premises control that substitutes threaten to erode.
The continued success of the UniFi ecosystem relies on demonstrating that the total value-including performance, security, and management-outweighs the OpEx cost of cloud services or the feature limitations of open-source/consumer hardware. You need to keep an eye on the following areas where substitution pressure is highest:
- Cost-sensitive SMBs choosing subscription over CapEx.
- Large enterprises prioritizing vendor-neutral, open-source infrastructure.
- The speed at which cloud providers integrate advanced, AI-driven network management.
- The adoption rate of 2.5 GbE and 10 GbE infrastructure in customer environments.
Ubiquiti Inc. (UI) - Porter's Five Forces: Threat of new entrants
You're looking at the barriers to entry for Ubiquiti Inc. (UI), and honestly, the company has built some pretty tall fences, but they aren't impenetrable. The sheer scale of investment required to compete head-to-head across the board is a major deterrent for any startup looking to jump in tomorrow.
High R&D spend of $169.7 million in fiscal 2025 creates a barrier to entry. That's a substantial commitment to innovation, showing they are serious about staying ahead of the technology curve, especially with new standards like Wi-Fi 7 rolling out. For a new player, matching that level of investment while simultaneously building out a global supply chain is tough. Here's the quick math on that commitment:
| Fiscal Year | R&D Expenses (Millions USD) |
|---|---|
| Fiscal 2025 | $169.7 million |
| Fiscal 2024 | $159.8 million |
| Fiscal 2023 | $145.2 million |
Brand loyalty and the closed UniFi ecosystem create high customer switching costs. Once an IT department standardizes on UniFi OS, they get a unified management platform for everything-Wi-Fi, Protect video, Access control-all without recurring license fees. That single pane of glass simplifies life immensely. If you rip that out, you're not just replacing hardware; you're retraining staff and potentially re-architecting your entire management strategy. It's a sticky situation for the customer, which is a good defense for Ubiquiti Inc.
Capital requirements for global distribution and manufacturing are substantial. Ubiquiti Inc. doesn't rely on a massive direct sales force; instead, they use an asset-light model leveraging global partners. Still, maintaining that reach is costly. In fiscal 2025, they sold products in over 75 countries through a network of more than 100 distributors. Building that logistical backbone from scratch is a massive upfront capital drain that new entrants have to face.
New entrants still emerge, especially in niche or low-cost segments. While the high-end enterprise space is dominated by established giants, the middle ground where Ubiquiti Inc. thrives is always being tested. The market is dynamic, with vendor share shifts happening, as seen in the campus switch market growth in 2Q 2025. You've definitely got to watch these players:
- Cisco Systems
- Hewlett Packard Enterprise (Juniper Networks)
- NETGEAR
- Fortinet
- TP-Link
- D-Link
To be fair, these established competitors have deep pockets and existing enterprise relationships. For a new entrant, the path is often to target a specific, underserved niche-maybe a super-low-cost segment or a highly specialized vertical-rather than trying to replicate the entire UniFi stack at once. Finance: draft a sensitivity analysis on a 10% price erosion scenario by Friday.
Disclaimer
All information, articles, and product details provided on this website are for general informational and educational purposes only. We do not claim any ownership over, nor do we intend to infringe upon, any trademarks, copyrights, logos, brand names, or other intellectual property mentioned or depicted on this site. Such intellectual property remains the property of its respective owners, and any references here are made solely for identification or informational purposes, without implying any affiliation, endorsement, or partnership.
We make no representations or warranties, express or implied, regarding the accuracy, completeness, or suitability of any content or products presented. Nothing on this website should be construed as legal, tax, investment, financial, medical, or other professional advice. In addition, no part of this site—including articles or product references—constitutes a solicitation, recommendation, endorsement, advertisement, or offer to buy or sell any securities, franchises, or other financial instruments, particularly in jurisdictions where such activity would be unlawful.
All content is of a general nature and may not address the specific circumstances of any individual or entity. It is not a substitute for professional advice or services. Any actions you take based on the information provided here are strictly at your own risk. You accept full responsibility for any decisions or outcomes arising from your use of this website and agree to release us from any liability in connection with your use of, or reliance upon, the content or products found herein.