
|
Ul Solutions Inc. (ULS) Avaliação DCF |
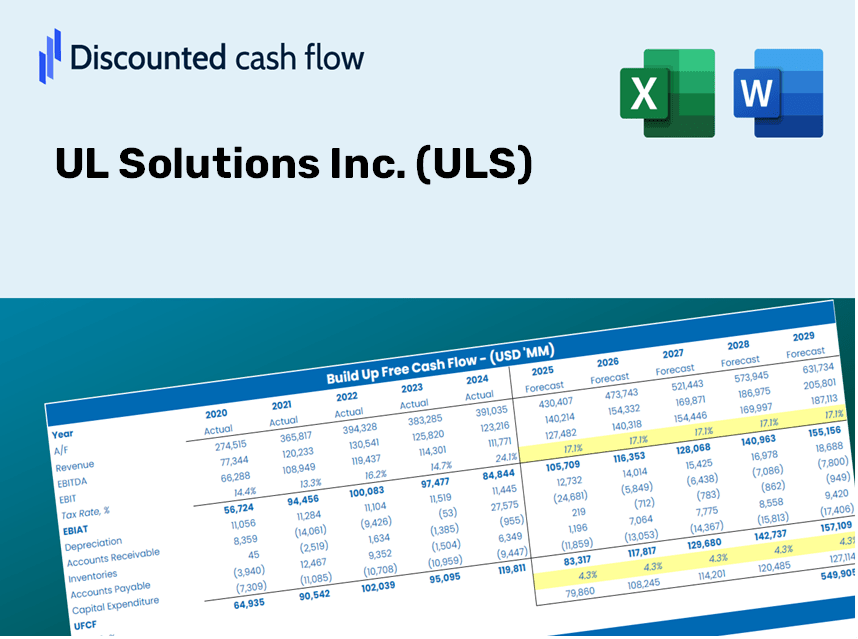
Totalmente Editável: Adapte-Se Às Suas Necessidades No Excel Ou Planilhas
Design Profissional: Modelos Confiáveis E Padrão Da Indústria
Pré-Construídos Para Uso Rápido E Eficiente
Compatível com MAC/PC, totalmente desbloqueado
Não É Necessária Experiência; Fácil De Seguir
UL Solutions Inc. (ULS) Bundle
Projetado para precisão, nossa calculadora DCF (ULS) permite avaliar a avaliação da UL Solutions Inc. usando dados financeiros do mundo real, fornecendo flexibilidade completa para ajustar todos os parâmetros essenciais para as projeções aprimoradas.
What You'll Receive
- Comprehensive Financial Model: Leverage UL Solutions Inc.'s (ULS) actual data for accurate DCF valuation.
- Complete Forecasting Flexibility: Modify revenue growth, margins, WACC, and other essential factors.
- Real-Time Calculations: Immediate updates provide instant results as you adjust parameters.
- Professional-Grade Template: An expertly crafted Excel file intended for high-level valuation.
- Adaptable and Reusable: Designed for versatility, making it easy to generate detailed forecasts multiple times.
Key Features
- Customizable Forecast Inputs: Adjust essential elements such as revenue growth, EBITDA %, and capital expenditures.
- Instant DCF Valuation: Quickly computes intrinsic value, NPV, and other financial metrics.
- High-Accuracy Results: Leverages UL Solutions Inc.’s (ULS) real-world financial data for precise valuation findings.
- Simplified Scenario Analysis: Effortlessly explore various assumptions and analyze the resulting outcomes.
- Efficiency Boost: Avoid the hassle of constructing intricate valuation models from the ground up.
How It Functions
- 1. Access the Template: Download and open the Excel file featuring UL Solutions Inc.'s (ULS) preloaded data.
- 2. Modify Assumptions: Adjust key inputs such as growth rates, WACC, and capital expenditures to fit your analysis.
- 3. View Results in Real-Time: The DCF model automatically calculates the intrinsic value and NPV based on your inputs.
- 4. Explore Scenarios: Evaluate various forecasts to assess different valuation possibilities for UL Solutions Inc. (ULS).
- 5. Present with Confidence: Deliver professional valuation insights to underpin your strategic decisions.
Why Opt for This Calculator?
- All-in-One Tool: Combines DCF, WACC, and financial ratio analyses tailored for UL Solutions Inc. (ULS).
- Flexible Inputs: Modify yellow-highlighted fields to explore different scenarios.
- In-Depth Analysis: Effortlessly computes the intrinsic value and Net Present Value for UL Solutions Inc. (ULS).
- Ready-to-Use Data: Historical and projected data provide reliable starting points for analysis.
- High-Caliber Functionality: Perfect for financial analysts, investors, and business advisors focused on UL Solutions Inc. (ULS).
Who Should Benefit from UL Solutions Inc. (ULS)?
- Investors: Gain precise insights into UL Solutions Inc.'s fair value to inform your investment choices.
- CFOs: Utilize a high-quality DCF model for accurate financial reporting and analysis.
- Consultants: Seamlessly customize the template for client valuation reports.
- Entrepreneurs: Acquire knowledge of financial modeling practices employed by industry leaders.
- Educators: Employ it as an educational resource to illustrate valuation techniques.
What the Template Includes
- Historical Data: Features UL Solutions Inc.'s past financial performance and foundational forecasts.
- DCF and Levered DCF Models: Comprehensive templates for determining the intrinsic value of UL Solutions Inc. (ULS).
- WACC Sheet: Ready-made calculations for the Weighted Average Cost of Capital.
- Editable Inputs: Adjust essential factors such as growth rates, EBITDA %, and CAPEX assumptions.
- Quarterly and Annual Statements: A thorough analysis of UL Solutions Inc.'s financial data.
- Interactive Dashboard: Dynamically visualize valuation outcomes and forecasts.
Disclaimer
All information, articles, and product details provided on this website are for general informational and educational purposes only. We do not claim any ownership over, nor do we intend to infringe upon, any trademarks, copyrights, logos, brand names, or other intellectual property mentioned or depicted on this site. Such intellectual property remains the property of its respective owners, and any references here are made solely for identification or informational purposes, without implying any affiliation, endorsement, or partnership.
We make no representations or warranties, express or implied, regarding the accuracy, completeness, or suitability of any content or products presented. Nothing on this website should be construed as legal, tax, investment, financial, medical, or other professional advice. In addition, no part of this site—including articles or product references—constitutes a solicitation, recommendation, endorsement, advertisement, or offer to buy or sell any securities, franchises, or other financial instruments, particularly in jurisdictions where such activity would be unlawful.
All content is of a general nature and may not address the specific circumstances of any individual or entity. It is not a substitute for professional advice or services. Any actions you take based on the information provided here are strictly at your own risk. You accept full responsibility for any decisions or outcomes arising from your use of this website and agree to release us from any liability in connection with your use of, or reliance upon, the content or products found herein.