
|
United Natural Foods, Inc. (UNFI) Avaliação DCF |
Totalmente Editável: Adapte-Se Às Suas Necessidades No Excel Ou Planilhas
Design Profissional: Modelos Confiáveis E Padrão Da Indústria
Pré-Construídos Para Uso Rápido E Eficiente
Compatível com MAC/PC, totalmente desbloqueado
Não É Necessária Experiência; Fácil De Seguir
United Natural Foods, Inc. (UNFI) Bundle
Aprimore suas estratégias de investimento com a Calculadora DCF da United Natural Foods, Inc. (UNFI)! Utilize dados financeiros reais, ajuste as previsões e despesas do crescimento e observe instantaneamente como essas alterações afetam o valor intrínseco do UNFI.
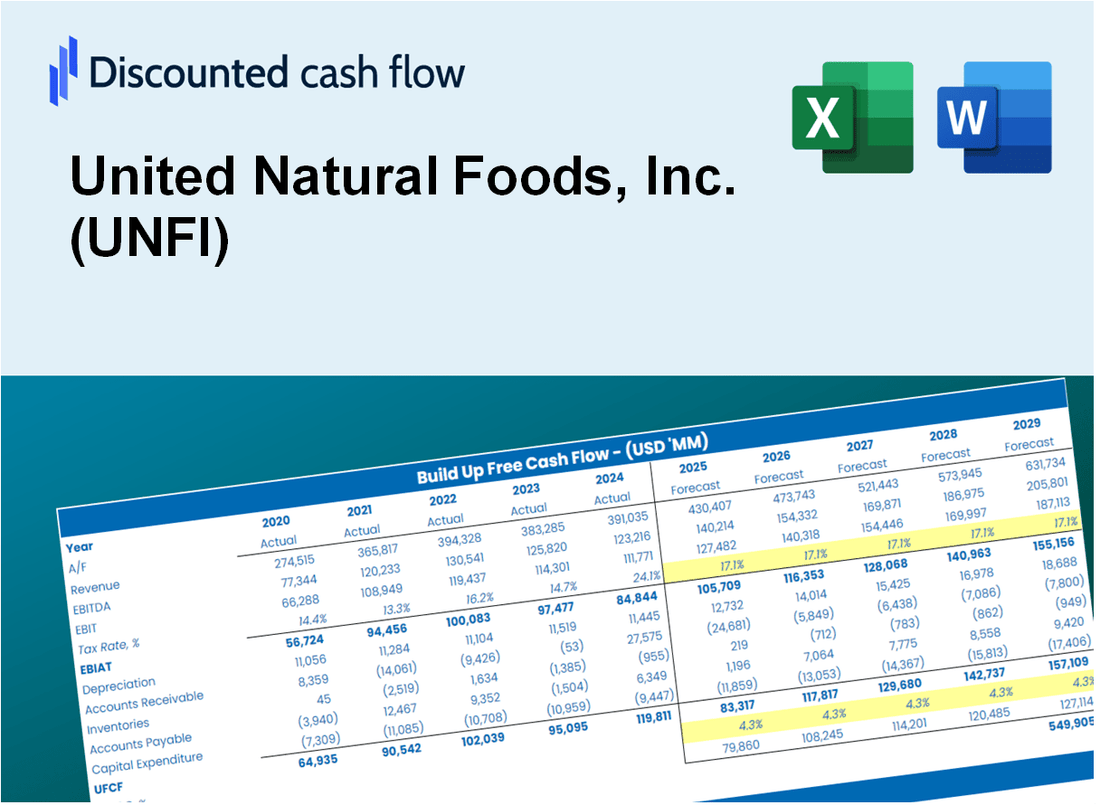
Discounted Cash Flow (DCF) - (USD MM)
| Year | AY1 2021 |
AY2 2022 |
AY3 2023 |
AY4 2024 |
AY5 2025 |
FY1 2026 |
FY2 2027 |
FY3 2028 |
FY4 2029 |
FY5 2030 |
|---|---|---|---|---|---|---|---|---|---|---|
| Revenue | 26,950.0 | 28,928.0 | 30,272.0 | 30,980.0 | 31,784.0 | 34,578.2 | 37,618.0 | 40,925.1 | 44,522.9 | 48,437.0 |
| Revenue Growth, % | 0 | 7.34 | 4.65 | 2.34 | 2.6 | 8.79 | 8.79 | 8.79 | 8.79 | 8.79 |
| EBITDA | 599.0 | 732.0 | 444.0 | 328.0 | -31.0 | 496.6 | 540.3 | 587.8 | 639.4 | 695.6 |
| EBITDA, % | 2.22 | 2.53 | 1.47 | 1.06 | -0.09753335 | 1.44 | 1.44 | 1.44 | 1.44 | 1.44 |
| Depreciation | 287.0 | 285.0 | 304.0 | 319.0 | 321.0 | 352.3 | 383.3 | 416.9 | 453.6 | 493.5 |
| Depreciation, % | 1.06 | 0.9852 | 1 | 1.03 | 1.01 | 1.02 | 1.02 | 1.02 | 1.02 | 1.02 |
| EBIT | 312.0 | 447.0 | 140.0 | 9.0 | -352.0 | 144.3 | 157.0 | 170.8 | 185.8 | 202.2 |
| EBIT, % | 1.16 | 1.55 | 0.46247 | 0.029051 | -1.11 | 0.41739 | 0.41739 | 0.41739 | 0.41739 | 0.41739 |
| Total Cash | 41.0 | 44.0 | 37.0 | 40.0 | 44.0 | 48.0 | 52.2 | 56.8 | 61.8 | 67.2 |
| Total Cash, percent | .0 | .0 | .0 | .0 | .0 | .0 | .0 | .0 | .0 | .0 |
| Account Receivables | 1,103.0 | 1,214.0 | 889.0 | 953.0 | 1,093.0 | 1,226.9 | 1,334.8 | 1,452.1 | 1,579.8 | 1,718.7 |
| Account Receivables, % | 4.09 | 4.2 | 2.94 | 3.08 | 3.44 | 3.55 | 3.55 | 3.55 | 3.55 | 3.55 |
| Inventories | 2,247.0 | 2,355.0 | 2,292.0 | 2,179.0 | 2,095.0 | 2,605.5 | 2,834.5 | 3,083.7 | 3,354.8 | 3,649.7 |
| Inventories, % | 8.34 | 8.14 | 7.57 | 7.03 | 6.59 | 7.53 | 7.53 | 7.53 | 7.53 | 7.53 |
| Accounts Payable | 1,644.0 | 1,742.0 | 1,781.0 | 1,688.0 | 1,875.0 | 2,030.0 | 2,208.4 | 2,402.6 | 2,613.8 | 2,843.6 |
| Accounts Payable, % | 6.1 | 6.02 | 5.88 | 5.45 | 5.9 | 5.87 | 5.87 | 5.87 | 5.87 | 5.87 |
| Capital Expenditure | -310.0 | -251.0 | -323.0 | -345.0 | -231.0 | -340.6 | -370.6 | -403.1 | -438.6 | -477.1 |
| Capital Expenditure, % | -1.15 | -0.86767 | -1.07 | -1.11 | -0.72678 | -0.98507 | -0.98507 | -0.98507 | -0.98507 | -0.98507 |
| Tax Rate, % | 23.38 | 23.38 | 23.38 | 23.38 | 23.38 | 23.38 | 23.38 | 23.38 | 23.38 | 23.38 |
| EBITAT | 254.0 | 357.6 | 480.0 | 7.4 | -269.7 | 121.2 | 131.8 | 143.4 | 156.0 | 169.7 |
| Depreciation | ||||||||||
| Changes in Account Receivables | ||||||||||
| Changes in Inventories | ||||||||||
| Changes in Accounts Payable | ||||||||||
| Capital Expenditure | ||||||||||
| UFCF | -1,475.0 | 270.6 | 888.0 | -62.6 | -48.7 | -356.6 | -13.9 | -15.2 | -16.5 | -17.9 |
| WACC, % | 5.24 | 5.2 | 5.73 | 5.25 | 5.11 | 5.3 | 5.3 | 5.3 | 5.3 | 5.3 |
| PV UFCF | ||||||||||
| SUM PV UFCF | -391.4 | |||||||||
| Long Term Growth Rate, % | 3.00 | |||||||||
| Free cash flow (T + 1) | -18 | |||||||||
| Terminal Value | -802 | |||||||||
| Present Terminal Value | -619 | |||||||||
| Enterprise Value | -1,011 | |||||||||
| Net Debt | 3,407 | |||||||||
| Equity Value | -4,418 | |||||||||
| Diluted Shares Outstanding, MM | 60 | |||||||||
| Equity Value Per Share | -73.39 |
What You Will Receive
- Pre-Filled Financial Model: UNFI’s actual data provides an accurate DCF valuation.
- Complete Forecast Control: Modify revenue growth, margins, WACC, and other essential drivers.
- Instantaneous Calculations: Automatic updates allow you to see results in real-time as you adjust inputs.
- Investor-Ready Template: A polished Excel file crafted for high-quality valuation.
- Customizable and Reusable: Designed for versatility, enabling repeated use for comprehensive forecasts.
Key Features
- Comprehensive DCF Calculator: Offers detailed unlevered and levered DCF valuation models tailored for United Natural Foods, Inc. (UNFI).
- WACC Calculator: Features a pre-built Weighted Average Cost of Capital sheet with customizable inputs specific to UNFI.
- Adjustable Forecast Assumptions: Easily modify growth rates, capital expenditures, and discount rates for accurate projections.
- Integrated Financial Ratios: Evaluate profitability, leverage, and efficiency ratios relevant to United Natural Foods, Inc. (UNFI).
- Interactive Dashboard and Charts: Visual representations summarize key valuation metrics for straightforward analysis.
How It Works
- Download the Template: Gain immediate access to the Excel-based UNFI DCF Calculator.
- Input Your Assumptions: Modify the yellow-highlighted cells for growth rates, WACC, margins, and additional parameters.
- Instant Calculations: The model automatically recalculates United Natural Foods, Inc.'s intrinsic value.
- Test Scenarios: Experiment with various assumptions to assess potential valuation shifts.
- Analyze and Decide: Utilize the results to inform your investment or financial strategy.
Why Choose This Calculator for United Natural Foods, Inc. (UNFI)?
- Accurate Data: Access to real United Natural Foods financials guarantees dependable valuation outcomes.
- Customizable: Tailor essential parameters such as growth rates, WACC, and tax rates to align with your forecasts.
- Time-Saving: Pre-configured calculations save you the effort of building from the ground up.
- Professional-Grade Tool: Crafted for investors, analysts, and consultants in the food distribution sector.
- User-Friendly: Simple design and guided instructions ensure ease of use for all skill levels.
Who Should Use This Product?
- Nutrition Students: Explore supply chain dynamics and apply them using real-world data from United Natural Foods, Inc. (UNFI).
- Researchers: Integrate industry-specific models into academic studies or projects.
- Retail Investors: Validate your investment strategies and evaluate market performance for United Natural Foods, Inc. (UNFI).
- Market Analysts: Enhance your analysis with a tailored, user-friendly financial model for UNFI.
- Entrepreneurs: Understand how major food distributors like United Natural Foods, Inc. (UNFI) operate within the market.
What the Template Contains
- Historical Data: Includes United Natural Foods, Inc.’s (UNFI) past financials and baseline forecasts.
- DCF and Levered DCF Models: Detailed templates to calculate United Natural Foods, Inc.’s (UNFI) intrinsic value.
- WACC Sheet: Pre-built calculations for Weighted Average Cost of Capital.
- Editable Inputs: Modify key drivers like growth rates, EBITDA %, and CAPEX assumptions.
- Quarterly and Annual Statements: A complete breakdown of United Natural Foods, Inc.’s (UNFI) financials.
- Interactive Dashboard: Visualize valuation results and projections dynamically.
Disclaimer
All information, articles, and product details provided on this website are for general informational and educational purposes only. We do not claim any ownership over, nor do we intend to infringe upon, any trademarks, copyrights, logos, brand names, or other intellectual property mentioned or depicted on this site. Such intellectual property remains the property of its respective owners, and any references here are made solely for identification or informational purposes, without implying any affiliation, endorsement, or partnership.
We make no representations or warranties, express or implied, regarding the accuracy, completeness, or suitability of any content or products presented. Nothing on this website should be construed as legal, tax, investment, financial, medical, or other professional advice. In addition, no part of this site—including articles or product references—constitutes a solicitation, recommendation, endorsement, advertisement, or offer to buy or sell any securities, franchises, or other financial instruments, particularly in jurisdictions where such activity would be unlawful.
All content is of a general nature and may not address the specific circumstances of any individual or entity. It is not a substitute for professional advice or services. Any actions you take based on the information provided here are strictly at your own risk. You accept full responsibility for any decisions or outcomes arising from your use of this website and agree to release us from any liability in connection with your use of, or reliance upon, the content or products found herein.