
|
Upland Software, Inc. (UPLD) Avaliação DCF |
Totalmente Editável: Adapte-Se Às Suas Necessidades No Excel Ou Planilhas
Design Profissional: Modelos Confiáveis E Padrão Da Indústria
Pré-Construídos Para Uso Rápido E Eficiente
Compatível com MAC/PC, totalmente desbloqueado
Não É Necessária Experiência; Fácil De Seguir
Upland Software, Inc. (UPLD) Bundle
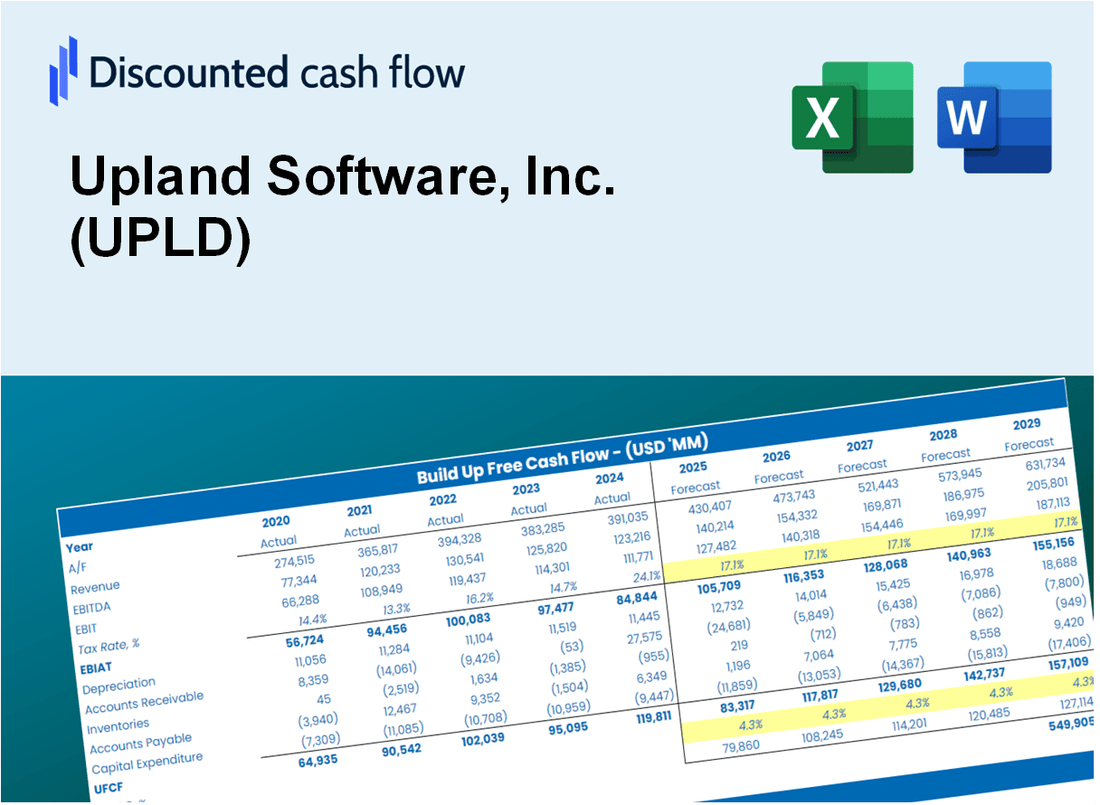
Obtenha um entendimento mais profundo da sua análise de avaliação de Upland Software, Inc. (UPLD) com nossa poderosa calculadora DCF! Pré -carregado com dados Real Upland Software, Inc. (UPLD), este modelo do Excel permite ajustar as previsões e suposições para determinar com precisão o valor intrínseco da Upland Software, Inc. (UPLD).
Discounted Cash Flow (DCF) - (USD MM)
| Year | AY1 2020 |
AY2 2021 |
AY3 2022 |
AY4 2023 |
AY5 2024 |
FY1 2025 |
FY2 2026 |
FY3 2027 |
FY4 2028 |
FY5 2029 |
|---|---|---|---|---|---|---|---|---|---|---|
| Revenue | 291.8 | 302.0 | 317.3 | 297.9 | 274.8 | 271.2 | 267.6 | 264.0 | 260.5 | 257.1 |
| Revenue Growth, % | 0 | 3.51 | 5.06 | -6.13 | -7.74 | -1.33 | -1.33 | -1.33 | -1.33 | -1.33 |
| EBITDA | 23.2 | 18.0 | 15.1 | -91.7 | -46.2 | -15.7 | -15.5 | -15.3 | -15.1 | -14.9 |
| EBITDA, % | 7.96 | 5.96 | 4.77 | -30.79 | -16.8 | -5.78 | -5.78 | -5.78 | -5.78 | -5.78 |
| Depreciation | 47.2 | 52.9 | 56.1 | 72.0 | 55.0 | 51.8 | 51.1 | 50.5 | 49.8 | 49.1 |
| Depreciation, % | 16.16 | 17.52 | 17.69 | 24.17 | 20.01 | 19.11 | 19.11 | 19.11 | 19.11 | 19.11 |
| EBIT | -23.9 | -34.9 | -41.0 | -163.7 | -101.2 | -67.5 | -66.6 | -65.7 | -64.8 | -64.0 |
| EBIT, % | -8.2 | -11.57 | -12.92 | -54.95 | -36.81 | -24.89 | -24.89 | -24.89 | -24.89 | -24.89 |
| Total Cash | 250.0 | 189.2 | 248.7 | 236.6 | 56.4 | 177.1 | 174.8 | 172.5 | 170.2 | 167.9 |
| Total Cash, percent | .0 | .0 | .0 | .0 | .0 | .0 | .0 | .0 | .0 | .0 |
| Account Receivables | 49.0 | 55.3 | 52.9 | 45.2 | 42.9 | 44.8 | 44.2 | 43.6 | 43.0 | 42.5 |
| Account Receivables, % | 16.8 | 18.31 | 16.67 | 15.19 | 15.59 | 16.51 | 16.51 | 16.51 | 16.51 | 16.51 |
| Inventories | 5.8 | .0 | 11.0 | .0 | .0 | 2.9 | 2.9 | 2.9 | 2.8 | 2.8 |
| Inventories, % | 1.98 | 0 | 3.45 | 0 | 0 | 1.09 | 1.09 | 1.09 | 1.09 | 1.09 |
| Accounts Payable | 5.4 | 20.4 | 14.9 | 8.1 | 9.4 | 10.5 | 10.4 | 10.3 | 10.1 | 10.0 |
| Accounts Payable, % | 1.85 | 6.74 | 4.71 | 2.73 | 3.42 | 3.89 | 3.89 | 3.89 | 3.89 | 3.89 |
| Capital Expenditure | -1.3 | -1.1 | -.9 | -1.2 | -.9 | -1.0 | -1.0 | -1.0 | -1.0 | -.9 |
| Capital Expenditure, % | -0.45069 | -0.36919 | -0.27293 | -0.4096 | -0.32097 | -0.36467 | -0.36467 | -0.36467 | -0.36467 | -0.36467 |
| Tax Rate, % | -2.4 | -2.4 | -2.4 | -2.4 | -2.4 | -2.4 | -2.4 | -2.4 | -2.4 | -2.4 |
| EBITAT | -22.1 | -30.6 | -40.0 | -161.4 | -103.6 | -64.2 | -63.4 | -62.6 | -61.7 | -60.9 |
| Depreciation | ||||||||||
| Changes in Account Receivables | ||||||||||
| Changes in Inventories | ||||||||||
| Changes in Accounts Payable | ||||||||||
| Capital Expenditure | ||||||||||
| UFCF | -25.7 | 35.7 | 1.3 | -78.9 | -45.8 | -17.1 | -12.7 | -12.6 | -12.4 | -12.2 |
| WACC, % | 4.33 | 4.17 | 4.49 | 4.53 | 4.57 | 4.42 | 4.42 | 4.42 | 4.42 | 4.42 |
| PV UFCF | ||||||||||
| SUM PV UFCF | -59.4 | |||||||||
| Long Term Growth Rate, % | 2.00 | |||||||||
| Free cash flow (T + 1) | -12 | |||||||||
| Terminal Value | -517 | |||||||||
| Present Terminal Value | -416 | |||||||||
| Enterprise Value | -476 | |||||||||
| Net Debt | 236 | |||||||||
| Equity Value | -711 | |||||||||
| Diluted Shares Outstanding, MM | 28 | |||||||||
| Equity Value Per Share | -25.60 |
What You Will Get
- Comprehensive UPLD Financials: Access to both historical and projected data for precise valuation.
- Customizable Inputs: Adjust WACC, tax rates, revenue growth, and capital expenditures as needed.
- Dynamic Calculations: Intrinsic value and NPV are computed in real-time.
- Scenario Analysis: Evaluate various scenarios to assess Upland Software's future performance.
- User-Friendly Design: Tailored for professionals while remaining approachable for newcomers.
Key Features
- Comprehensive DCF Calculator: Features detailed unlevered and levered DCF valuation models tailored for Upland Software, Inc. (UPLD).
- WACC Calculator: Comes with a pre-built Weighted Average Cost of Capital sheet that allows for customizable inputs specific to Upland Software.
- Customizable Forecast Assumptions: Adjust growth rates, capital expenditures, and discount rates to fit Upland Software's financial outlook.
- Integrated Financial Ratios: Evaluate profitability, leverage, and efficiency ratios pertinent to Upland Software, Inc. (UPLD).
- Visual Dashboard and Charts: Graphical outputs that summarize essential valuation metrics for straightforward analysis.
How It Works
- Download: Obtain the ready-to-use Excel file featuring Upland Software, Inc.'s (UPLD) financial data.
- Customize: Modify forecasts such as revenue growth, EBITDA %, and WACC as needed.
- Update Automatically: The intrinsic value and NPV calculations refresh in real-time.
- Test Scenarios: Generate various projections and instantly compare the results.
- Make Decisions: Leverage the valuation outcomes to inform your investment strategy.
Why Choose This Calculator for Upland Software, Inc. (UPLD)?
- Designed for Experts: A sophisticated tool utilized by analysts, CFOs, and strategic consultants.
- Comprehensive Data: Upland Software’s historical and forecasted financials are preloaded for precision.
- Scenario Analysis: Effortlessly simulate various forecasts and assumptions.
- Clear Results: Automatically computes intrinsic value, NPV, and essential metrics.
- User-Friendly: Step-by-step guidance helps you navigate the process seamlessly.
Who Should Use This Product?
- Investors: Accurately estimate Upland Software, Inc.'s (UPLD) fair value before making investment decisions.
- CFOs: Leverage a professional-grade DCF model for financial reporting and analysis related to Upland Software, Inc. (UPLD).
- Consultants: Quickly adapt the template for valuation reports for clients interested in Upland Software, Inc. (UPLD).
- Entrepreneurs: Gain insights into financial modeling practices utilized by leading companies like Upland Software, Inc. (UPLD).
- Educators: Use it as a teaching tool to demonstrate valuation methodologies applicable to Upland Software, Inc. (UPLD).
What the Template Contains
- Preloaded UPLD Data: Historical and projected financial data, including revenue, EBIT, and capital expenditures.
- DCF and WACC Models: Professional-grade sheets for calculating intrinsic value and Weighted Average Cost of Capital.
- Editable Inputs: Yellow-highlighted cells for adjusting revenue growth, tax rates, and discount rates.
- Financial Statements: Comprehensive annual and quarterly financials for deeper analysis.
- Key Ratios: Profitability, leverage, and efficiency ratios to evaluate performance.
- Dashboard and Charts: Visual summaries of valuation outcomes and assumptions.
Disclaimer
All information, articles, and product details provided on this website are for general informational and educational purposes only. We do not claim any ownership over, nor do we intend to infringe upon, any trademarks, copyrights, logos, brand names, or other intellectual property mentioned or depicted on this site. Such intellectual property remains the property of its respective owners, and any references here are made solely for identification or informational purposes, without implying any affiliation, endorsement, or partnership.
We make no representations or warranties, express or implied, regarding the accuracy, completeness, or suitability of any content or products presented. Nothing on this website should be construed as legal, tax, investment, financial, medical, or other professional advice. In addition, no part of this site—including articles or product references—constitutes a solicitation, recommendation, endorsement, advertisement, or offer to buy or sell any securities, franchises, or other financial instruments, particularly in jurisdictions where such activity would be unlawful.
All content is of a general nature and may not address the specific circumstances of any individual or entity. It is not a substitute for professional advice or services. Any actions you take based on the information provided here are strictly at your own risk. You accept full responsibility for any decisions or outcomes arising from your use of this website and agree to release us from any liability in connection with your use of, or reliance upon, the content or products found herein.