
|
Vale S.A. (Vale) DCF Avaliação |
Totalmente Editável: Adapte-Se Às Suas Necessidades No Excel Ou Planilhas
Design Profissional: Modelos Confiáveis E Padrão Da Indústria
Pré-Construídos Para Uso Rápido E Eficiente
Compatível com MAC/PC, totalmente desbloqueado
Não É Necessária Experiência; Fácil De Seguir
Vale S.A. (VALE) Bundle
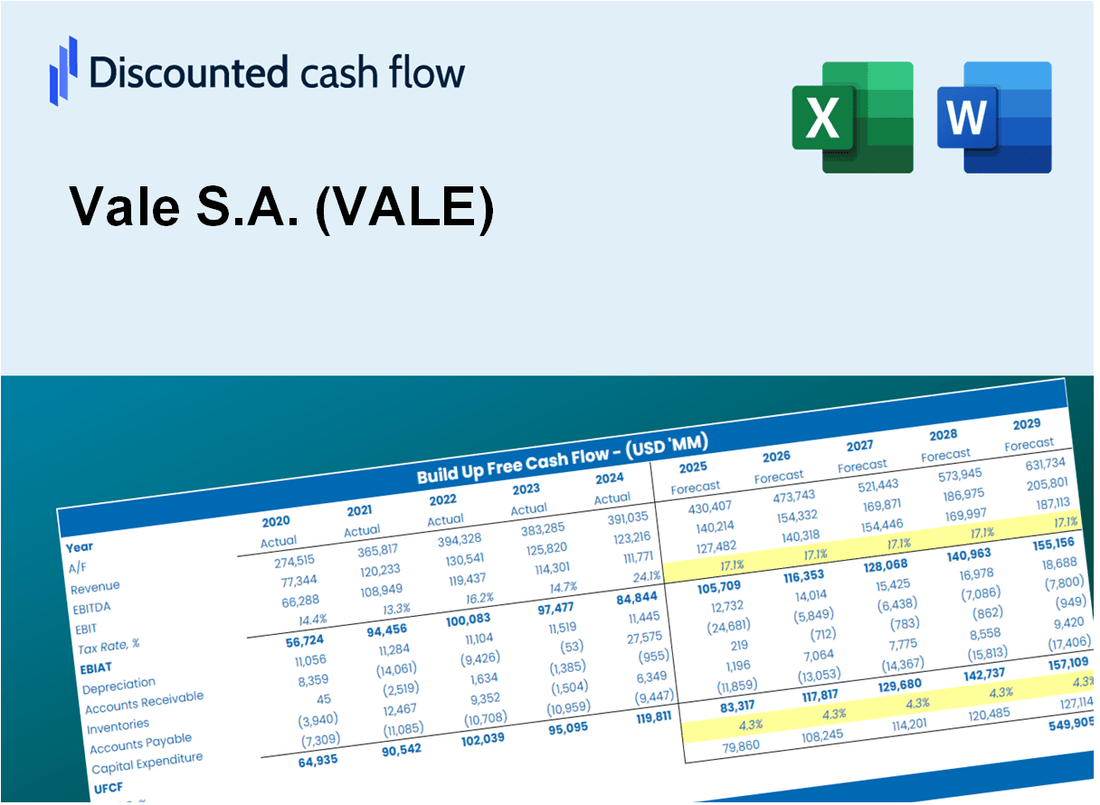
Obtenha informações sobre sua análise de avaliação Vale S.A. (Vale) com nossa calculadora DCF de ponta! Este modelo do Excel é pré -carregado com dados reais da Vale, permitindo ajustar as previsões e suposições para um cálculo preciso do valor intrínseco da Vale S.A..
What You Will Get
- Real VALE Financial Data: Pre-filled with Vale S.A.'s historical and projected data for precise analysis.
- Fully Editable Template: Modify key inputs like revenue growth, WACC, and EBITDA % with ease.
- Automatic Calculations: See Vale S.A.'s intrinsic value update instantly based on your changes.
- Professional Valuation Tool: Designed for investors, analysts, and consultants seeking accurate DCF results.
- User-Friendly Design: Simple structure and clear instructions for all experience levels.
Key Features
- Authentic Vale Financials: Access reliable pre-loaded historical data and future projections for Vale S.A. (VALE).
- Adjustable Forecast Assumptions: Modify highlighted cells for parameters such as WACC, growth rates, and profit margins.
- Real-Time Calculations: Automatic updates to DCF, Net Present Value (NPV), and cash flow assessments.
- Interactive Dashboard: User-friendly charts and summaries to visualize your valuation outcomes.
- Designed for All Users: An intuitive layout tailored for investors, CFOs, and consultants alike.
How It Works
- Download: Obtain the pre-configured Excel file containing Vale S.A.'s (VALE) financial data.
- Customize: Modify projections such as revenue growth, EBITDA %, and WACC to fit your analysis.
- Update Automatically: The intrinsic value and NPV calculations refresh in real-time based on your inputs.
- Test Scenarios: Develop various projections and evaluate different outcomes instantly.
- Make Decisions: Leverage the valuation results to inform your investment strategy for Vale S.A. (VALE).
Why Choose This Calculator for Vale S.A. (VALE)?
- Designed for Experts: A sophisticated tool utilized by financial analysts, CFOs, and industry consultants.
- Accurate Financial Data: Vale S.A.’s historical and projected financial information is preloaded for precision.
- Comprehensive Scenario Analysis: Effortlessly simulate various forecasts and assumptions.
- Insightful Outputs: Automatically computes intrinsic value, NPV, and essential financial metrics.
- User-Friendly: Step-by-step guidance makes the process straightforward.
Who Should Use Vale S.A. (VALE)?
- Investors: Gain insights into the mining sector with comprehensive resources tailored for informed decision-making.
- Financial Analysts: Streamline your analysis with detailed reports and data on Vale S.A. (VALE) performance.
- Consultants: Easily customize presentations and reports using Vale S.A. (VALE) data for your clients.
- Finance Enthusiasts: Enhance your knowledge of the commodities market through Vale S.A. (VALE) case studies and analyses.
- Educators and Students: Utilize real-world examples from Vale S.A. (VALE) in finance and investment courses.
What the Template Contains
- Operating and Balance Sheet Data: Pre-filled Vale S.A. (VALE) historical data and forecasts, including revenue, EBITDA, EBIT, and capital expenditures.
- WACC Calculation: A dedicated sheet for Weighted Average Cost of Capital (WACC), including parameters like Beta, risk-free rate, and share price.
- DCF Valuation (Unlevered and Levered): Editable Discounted Cash Flow models showing intrinsic value with detailed calculations.
- Financial Statements: Pre-loaded financial statements (annual and quarterly) to support analysis.
- Key Ratios: Includes profitability, leverage, and efficiency ratios for Vale S.A. (VALE).
- Dashboard and Charts: Visual summary of valuation outputs and assumptions to analyze results easily.
Disclaimer
All information, articles, and product details provided on this website are for general informational and educational purposes only. We do not claim any ownership over, nor do we intend to infringe upon, any trademarks, copyrights, logos, brand names, or other intellectual property mentioned or depicted on this site. Such intellectual property remains the property of its respective owners, and any references here are made solely for identification or informational purposes, without implying any affiliation, endorsement, or partnership.
We make no representations or warranties, express or implied, regarding the accuracy, completeness, or suitability of any content or products presented. Nothing on this website should be construed as legal, tax, investment, financial, medical, or other professional advice. In addition, no part of this site—including articles or product references—constitutes a solicitation, recommendation, endorsement, advertisement, or offer to buy or sell any securities, franchises, or other financial instruments, particularly in jurisdictions where such activity would be unlawful.
All content is of a general nature and may not address the specific circumstances of any individual or entity. It is not a substitute for professional advice or services. Any actions you take based on the information provided here are strictly at your own risk. You accept full responsibility for any decisions or outcomes arising from your use of this website and agree to release us from any liability in connection with your use of, or reliance upon, the content or products found herein.