
|
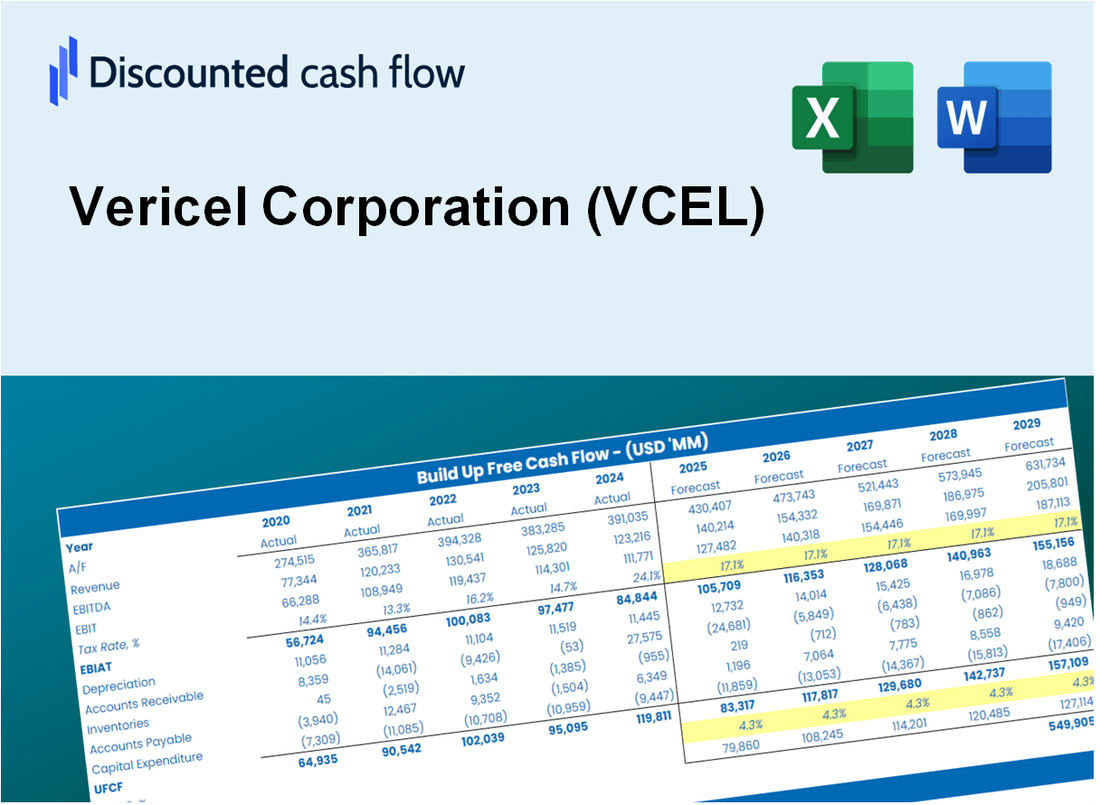
Avaliação DCF da Vericel Corporation (VCEL) |
Totalmente Editável: Adapte-Se Às Suas Necessidades No Excel Ou Planilhas
Design Profissional: Modelos Confiáveis E Padrão Da Indústria
Pré-Construídos Para Uso Rápido E Eficiente
Compatível com MAC/PC, totalmente desbloqueado
Não É Necessária Experiência; Fácil De Seguir
Vericel Corporation (VCEL) Bundle
Avalie as perspectivas financeiras da Vericel Corporation como um especialista! Esta calculadora DCF VCEL (VCEL) vem com finanças pré-preenchidas e oferece flexibilidade completa para modificar o crescimento da receita, WACC, margens e outras suposições essenciais para se alinhar às suas previsões.
Discounted Cash Flow (DCF) - (USD MM)
| Year | AY1 2020 |
AY2 2021 |
AY3 2022 |
AY4 2023 |
AY5 2024 |
FY1 2025 |
FY2 2026 |
FY3 2027 |
FY4 2028 |
FY5 2029 |
|---|---|---|---|---|---|---|---|---|---|---|
| Revenue | 124.2 | 156.2 | 164.4 | 197.5 | 237.2 | 279.5 | 329.3 | 388.0 | 457.1 | 538.6 |
| Revenue Growth, % | 0 | 25.77 | 5.24 | 20.17 | 20.1 | 17.82 | 17.82 | 17.82 | 17.82 | 17.82 |
| EBITDA | 9.9 | -4.6 | -11.6 | 2.9 | 16.6 | 3.6 | 4.2 | 4.9 | 5.8 | 6.9 |
| EBITDA, % | 7.95 | -2.95 | -7.08 | 1.45 | 7.01 | 1.28 | 1.28 | 1.28 | 1.28 | 1.28 |
| Depreciation | 6.8 | 7.4 | 8.2 | 4.6 | 5.5 | 11.1 | 13.1 | 15.4 | 18.2 | 21.4 |
| Depreciation, % | 5.5 | 4.73 | 4.99 | 2.35 | 2.32 | 3.98 | 3.98 | 3.98 | 3.98 | 3.98 |
| EBIT | 3.1 | -12.0 | -19.8 | -1.8 | 11.1 | -7.5 | -8.9 | -10.5 | -12.3 | -14.5 |
| EBIT, % | 2.46 | -7.68 | -12.07 | -0.89512 | 4.69 | -2.7 | -2.7 | -2.7 | -2.7 | -2.7 |
| Total Cash | 75.8 | 103.4 | 119.5 | 109.6 | 116.2 | 170.2 | 200.5 | 236.2 | 278.3 | 327.9 |
| Total Cash, percent | .0 | .0 | .0 | .0 | .0 | .0 | .0 | .0 | .0 | .0 |
| Account Receivables | 34.5 | 37.4 | 46.5 | 58.4 | 61.4 | 75.7 | 89.2 | 105.1 | 123.9 | 145.9 |
| Account Receivables, % | 27.79 | 23.97 | 28.31 | 29.54 | 25.87 | 27.1 | 27.1 | 27.1 | 27.1 | 27.1 |
| Inventories | 9.4 | 13.4 | 16.0 | 13.1 | 17.4 | 22.2 | 26.2 | 30.9 | 36.4 | 42.8 |
| Inventories, % | 7.53 | 8.57 | 9.73 | 6.63 | 7.32 | 7.96 | 7.96 | 7.96 | 7.96 | 7.96 |
| Accounts Payable | 6.8 | 9.0 | 16.9 | 22.3 | 23.8 | 24.0 | 28.2 | 33.3 | 39.2 | 46.2 |
| Accounts Payable, % | 5.44 | 5.77 | 10.3 | 11.31 | 10.05 | 8.58 | 8.58 | 8.58 | 8.58 | 8.58 |
| Capital Expenditure | -2.6 | -7.9 | -7.6 | -27.5 | -64.0 | -29.5 | -34.7 | -40.9 | -48.2 | -56.8 |
| Capital Expenditure, % | -2.11 | -5.07 | -4.62 | -13.93 | -26.97 | -10.54 | -10.54 | -10.54 | -10.54 | -10.54 |
| Tax Rate, % | 1.41 | 1.41 | 1.41 | 1.41 | 1.41 | 1.41 | 1.41 | 1.41 | 1.41 | 1.41 |
| EBITAT | 2.9 | -11.8 | -20.7 | -2.4 | 11.0 | -7.4 | -8.7 | -10.3 | -12.1 | -14.3 |
| Depreciation | ||||||||||
| Changes in Account Receivables | ||||||||||
| Changes in Inventories | ||||||||||
| Changes in Accounts Payable | ||||||||||
| Capital Expenditure | ||||||||||
| UFCF | -30.0 | -17.0 | -23.9 | -28.8 | -53.3 | -44.9 | -43.5 | -51.3 | -60.4 | -71.2 |
| WACC, % | 9.92 | 9.93 | 9.94 | 9.94 | 9.93 | 9.93 | 9.93 | 9.93 | 9.93 | 9.93 |
| PV UFCF | ||||||||||
| SUM PV UFCF | -201.2 | |||||||||
| Long Term Growth Rate, % | 2.00 | |||||||||
| Free cash flow (T + 1) | -73 | |||||||||
| Terminal Value | -916 | |||||||||
| Present Terminal Value | -570 | |||||||||
| Enterprise Value | -772 | |||||||||
| Net Debt | 24 | |||||||||
| Equity Value | -796 | |||||||||
| Diluted Shares Outstanding, MM | 52 | |||||||||
| Equity Value Per Share | -15.40 |
What You Will Receive
- Comprehensive Financial Model: Vericel Corporation’s (VCEL) actual data facilitates accurate DCF analysis.
- Complete Forecast Flexibility: Modify revenue growth, profit margins, WACC, and other essential factors.
- Real-Time Calculations: Automatic updates allow you to view results instantly as you make adjustments.
- Professional-Grade Template: A polished Excel file crafted for high-quality valuation presentations.
- Adaptable and Reusable: Designed for versatility, enabling repeated use for in-depth financial forecasts.
Key Features
- Customizable Financial Metrics: Adjust essential inputs such as revenue projections, operating margins, and investment levels.
- Instant DCF Valuation: Quickly computes intrinsic value, net present value, and additional financial metrics.
- High-Precision Analytics: Leverages Vericel Corporation’s (VCEL) actual financial data for accurate valuation results.
- Effortless Scenario Testing: Easily evaluate various assumptions and analyze different outcomes.
- Efficiency Booster: Streamlines the valuation process, removing the need for intricate model development from the ground up.
How It Works
- Step 1: Download the prebuilt Excel template featuring Vericel Corporation's (VCEL) data.
- Step 2: Navigate through the pre-filled sheets to grasp the essential metrics.
- Step 3: Modify forecasts and assumptions in the editable yellow cells (WACC, growth, margins).
- Step 4: Instantly observe recalculated results, including Vericel Corporation's (VCEL) intrinsic value.
- Step 5: Make well-informed investment decisions or create reports based on the outputs.
Why Choose This Calculator for Vericel Corporation (VCEL)?
- Accuracy: Utilizes real Vericel financial data for precise calculations.
- Flexibility: Allows users to easily test and adjust their inputs as needed.
- Time-Saving: Eliminate the complexity of constructing a DCF model from the ground up.
- Professional-Grade: Crafted with the expertise and precision expected at the CFO level.
- User-Friendly: Intuitive interface suitable for users without extensive financial modeling skills.
Who Should Use This Product?
- Investors: Accurately estimate Vericel Corporation’s (VCEL) fair value before making investment decisions.
- CFOs: Leverage a professional-grade DCF model for financial reporting and analysis specific to Vericel Corporation (VCEL).
- Consultants: Quickly adapt the template for valuation reports tailored for Vericel Corporation (VCEL) clients.
- Entrepreneurs: Gain insights into financial modeling techniques used by leading biotech firms like Vericel Corporation (VCEL).
- Educators: Use it as a teaching tool to demonstrate valuation methodologies relevant to the biotech sector, including Vericel Corporation (VCEL).
What the Template Contains
- Preloaded VCEL Data: Historical and projected financial data, including revenue, EBIT, and capital expenditures.
- DCF and WACC Models: Professional-grade sheets for calculating intrinsic value and Weighted Average Cost of Capital.
- Editable Inputs: Yellow-highlighted cells for adjusting revenue growth, tax rates, and discount rates.
- Financial Statements: Comprehensive annual and quarterly financials for deeper analysis.
- Key Ratios: Profitability, leverage, and efficiency ratios to evaluate performance.
- Dashboard and Charts: Visual summaries of valuation outcomes and assumptions.
Disclaimer
All information, articles, and product details provided on this website are for general informational and educational purposes only. We do not claim any ownership over, nor do we intend to infringe upon, any trademarks, copyrights, logos, brand names, or other intellectual property mentioned or depicted on this site. Such intellectual property remains the property of its respective owners, and any references here are made solely for identification or informational purposes, without implying any affiliation, endorsement, or partnership.
We make no representations or warranties, express or implied, regarding the accuracy, completeness, or suitability of any content or products presented. Nothing on this website should be construed as legal, tax, investment, financial, medical, or other professional advice. In addition, no part of this site—including articles or product references—constitutes a solicitation, recommendation, endorsement, advertisement, or offer to buy or sell any securities, franchises, or other financial instruments, particularly in jurisdictions where such activity would be unlawful.
All content is of a general nature and may not address the specific circumstances of any individual or entity. It is not a substitute for professional advice or services. Any actions you take based on the information provided here are strictly at your own risk. You accept full responsibility for any decisions or outcomes arising from your use of this website and agree to release us from any liability in connection with your use of, or reliance upon, the content or products found herein.