
|
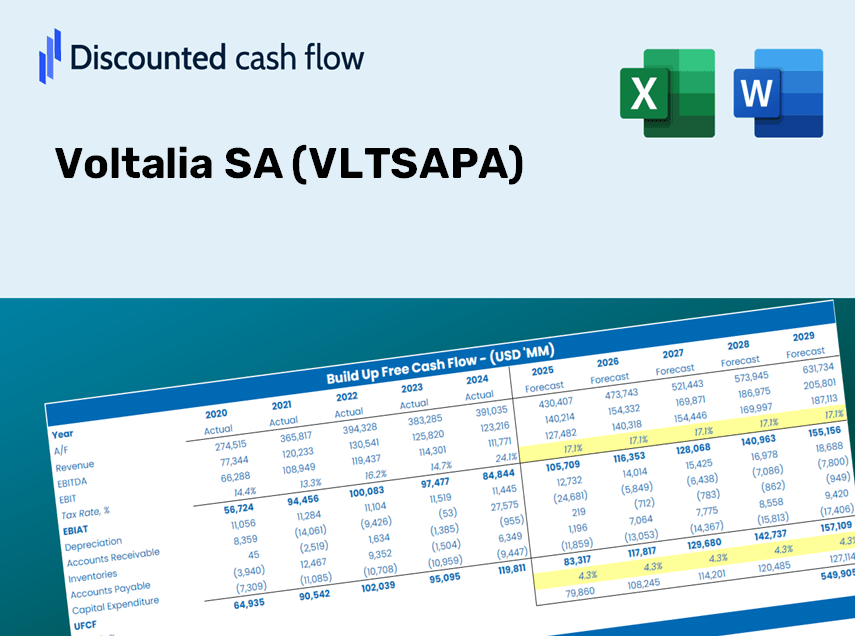
Voltalia SA (VLTSA.PA) DCF Valuation |
Totalmente Editável: Adapte-Se Às Suas Necessidades No Excel Ou Planilhas
Design Profissional: Modelos Confiáveis E Padrão Da Indústria
Pré-Construídos Para Uso Rápido E Eficiente
Compatível com MAC/PC, totalmente desbloqueado
Não É Necessária Experiência; Fácil De Seguir
Voltalia SA (VLTSA.PA) Bundle
Discover the true value of Voltalia SA (VLTSAPA) with our advanced DCF Calculator! Adjust essential assumptions, explore various scenarios, and evaluate how changes affect Voltalia SA (VLTSAPA) valuation – all within one convenient Excel template.
Discounted Cash Flow (DCF) - (USD MM)
| Year | AY1 2020 |
AY2 2021 |
AY3 2022 |
AY4 2023 |
AY5 2024 |
FY1 2025 |
FY2 2026 |
FY3 2027 |
FY4 2028 |
FY5 2029 |
|---|---|---|---|---|---|---|---|---|---|---|
| Revenue | 233.5 | 358.7 | 465.9 | 495.2 | 547.0 | 577.0 | 593.6 | 602.5 | 607.3 | 609.8 |
| Revenue Growth, % | 0 | 53.63 | 29.91 | 6.28 | 10.47 | 5.48 | 2.87 | 1.51 | 0.78866 | 0.41321 |
| EBITDA | 85.9 | 129.6 | 153.6 | 249.0 | 235.0 | 262.5 | 284.5 | 302.8 | 318.6 | 332.8 |
| EBITDA, % | 36.8 | 36.14 | 32.96 | 50.28 | 42.96 | 45.5 | 47.93 | 50.25 | 52.46 | 54.58 |
| Depreciation | 43.5 | 61.2 | 73.9 | 104.0 | 126.0 | 140.0 | 151.1 | 160.5 | 168.8 | 176.5 |
| Depreciation, % | 18.63 | 17.06 | 15.85 | 21 | 23.03 | 24.26 | 25.46 | 26.64 | 27.81 | 28.95 |
| EBIT | 42.4 | 68.4 | 79.7 | 145.0 | 109.0 | 123.1 | 134.9 | 145.2 | 154.5 | 163.1 |
| EBIT, % | 18.17 | 19.08 | 17.11 | 29.28 | 19.93 | 21.34 | 22.73 | 24.1 | 25.44 | 26.76 |
| Total Cash | 226.4 | 302.2 | 383.6 | 318.6 | 391.0 | 460.9 | 474.1 | 481.2 | 485.0 | 487.0 |
| Total Cash, percent | .0 | .0 | .0 | .0 | .0 | .0 | .0 | .0 | .0 | .0 |
| Account Receivables | 103.2 | 95.3 | 143.5 | 214.3 | 226.0 | 243.6 | 256.0 | 265.1 | 272.5 | 278.9 |
| Account Receivables, % | 44.23 | 26.58 | 30.79 | 43.29 | 41.32 | 42.23 | 43.12 | 44.01 | 44.88 | 45.73 |
| Inventories | 39.7 | 16.9 | 67.3 | 65.3 | 31.0 | 63.5 | 65.3 | 66.3 | 66.8 | 67.1 |
| Inventories, % | 17.01 | 4.7 | 14.44 | 13.19 | 5.67 | 11 | 11 | 11 | 11 | 11 |
| Accounts Payable | 125.5 | 146.2 | 172.1 | 208.0 | 164.5 | 234.8 | 241.6 | 245.2 | 247.2 | 248.2 |
| Accounts Payable, % | 53.74 | 40.75 | 36.94 | 42 | 30.08 | 40.7 | 40.7 | 40.7 | 40.7 | 40.7 |
| Capital Expenditure | -326.6 | -406.3 | -543.4 | -694.2 | -517.0 | -570.7 | -587.1 | -595.9 | -600.6 | -603.1 |
| Capital Expenditure, % | -139.88 | -113.28 | -116.63 | -140.19 | -94.52 | -98.9 | -98.9 | -98.9 | -98.9 | -98.9 |
| Tax Rate, % | -200 | -200 | -200 | -200 | -200 | -200 | -200 | -200 | -200 | -200 |
| EBITAT | 31.0 | -4.9 | -53.3 | 70.5 | 327.0 | 54.6 | 59.8 | 64.4 | 68.5 | 72.4 |
| Depreciation | ||||||||||
| Changes in Account Receivables | ||||||||||
| Changes in Inventories | ||||||||||
| Changes in Accounts Payable | ||||||||||
| Capital Expenditure | ||||||||||
| UFCF | -269.6 | -298.5 | -595.5 | -552.7 | -84.8 | -355.9 | -383.5 | -377.5 | -369.2 | -359.8 |
| WACC, % | 5.1 | 2.43 | 2.43 | 4.21 | 6.09 | 4.05 | 4.05 | 4.05 | 4.05 | 4.05 |
| PV UFCF | ||||||||||
| SUM PV UFCF | -1,641.3 | |||||||||
| Long Term Growth Rate, % | 3.90 | |||||||||
| Free cash flow (T + 1) | -374 | |||||||||
| Terminal Value | -245,496 | |||||||||
| Present Terminal Value | -201,274 | |||||||||
| Enterprise Value | -202,915 | |||||||||
| Net Debt | 1,432 | |||||||||
| Equity Value | -204,347 | |||||||||
| Diluted Shares Outstanding, MM | 131 | |||||||||
| Equity Value Per Share | -1,561.50 |
What You Will Receive
- Comprehensive VLTSAPA Financial Data: Pre-filled with Voltalia’s historical and projected figures for accurate analysis.
- Fully Customizable Template: Easily adjust key parameters such as revenue growth, WACC, and EBITDA %.
- Instant Calculations: Observe real-time updates of Voltalia’s intrinsic value based on your modifications.
- Professional Valuation Tool: Tailored for investors, analysts, and consultants requiring precise DCF outcomes.
- User-Friendly Interface: Clear layout and straightforward guidance suitable for all skill levels.
Highlighted Features
- Accurate Voltalia Financials: Gain access to reliable historical data and future forecasts that are pre-loaded.
- Adjustable Forecast Inputs: Modify the yellow-highlighted fields such as WACC, growth rates, and profit margins.
- Real-Time Calculations: Automatic refresh of DCF, Net Present Value (NPV), and cash flow assessments.
- Intuitive Visual Dashboard: User-friendly charts and summaries to help you visualize your valuation findings.
- Designed for All Skill Levels: A clear and straightforward layout tailored for investors, CFOs, and consultants alike.
How It Works
- Step 1: Download the Excel file for Voltalia SA (VLTSAPA).
- Step 2: Examine the pre-loaded data for Voltalia, including historical and projected figures.
- Step 3: Modify the key assumptions (highlighted in yellow) according to your analysis.
- Step 4: Observe the automatic recalculations reflecting Voltalia’s intrinsic value.
- Step 5: Utilize the results for your investment decisions or reporting needs.
Why Opt for This Calculator?
- All-in-One Solution: Features DCF, WACC, and financial ratio analyses conveniently combined.
- Flexible Inputs: Modify the yellow-highlighted fields to explore different scenarios.
- In-Depth Analysis: Automatically computes Voltalia SA's intrinsic value and Net Present Value.
- Integrated Data: Comes with historical and projected data, providing reliable starting metrics.
- High-Quality Output: Perfect for financial analysts, investors, and business consultants alike.
Who Should Benefit from This Product?
- Institutional Investors: Develop comprehensive and accurate valuation models for portfolio management.
- Corporate Finance Departments: Examine valuation scenarios to inform strategic decision-making.
- Financial Consultants and Advisors: Offer clients precise valuation analyses for Voltalia SA (VLTSAPA) stock.
- Students and Educators: Utilize real-world data to enhance understanding and instruction in financial modeling.
- Renewable Energy Enthusiasts: Gain insights into how companies like Voltalia SA (VLTSAPA) are valued in the market.
What the Template Includes for Voltalia SA (VLTSAPA)
- Historical Data: Contains Voltalia’s previous financials and foundational forecasts.
- DCF and Levered DCF Models: Comprehensive templates for estimating Voltalia’s intrinsic value.
- WACC Sheet: Ready-made calculations for the Weighted Average Cost of Capital.
- Editable Inputs: Adjust key variables such as growth rates, EBITDA %, and CAPEX assumptions.
- Quarterly and Annual Statements: An exhaustive overview of Voltalia’s financial performance.
- Interactive Dashboard: Dynamically visualize valuation outcomes and projections.
Disclaimer
All information, articles, and product details provided on this website are for general informational and educational purposes only. We do not claim any ownership over, nor do we intend to infringe upon, any trademarks, copyrights, logos, brand names, or other intellectual property mentioned or depicted on this site. Such intellectual property remains the property of its respective owners, and any references here are made solely for identification or informational purposes, without implying any affiliation, endorsement, or partnership.
We make no representations or warranties, express or implied, regarding the accuracy, completeness, or suitability of any content or products presented. Nothing on this website should be construed as legal, tax, investment, financial, medical, or other professional advice. In addition, no part of this site—including articles or product references—constitutes a solicitation, recommendation, endorsement, advertisement, or offer to buy or sell any securities, franchises, or other financial instruments, particularly in jurisdictions where such activity would be unlawful.
All content is of a general nature and may not address the specific circumstances of any individual or entity. It is not a substitute for professional advice or services. Any actions you take based on the information provided here are strictly at your own risk. You accept full responsibility for any decisions or outcomes arising from your use of this website and agree to release us from any liability in connection with your use of, or reliance upon, the content or products found herein.