
|
Vanda Pharmaceuticals Inc. (VNDA) Avaliação DCF |
Totalmente Editável: Adapte-Se Às Suas Necessidades No Excel Ou Planilhas
Design Profissional: Modelos Confiáveis E Padrão Da Indústria
Pré-Construídos Para Uso Rápido E Eficiente
Compatível com MAC/PC, totalmente desbloqueado
Não É Necessária Experiência; Fácil De Seguir
Vanda Pharmaceuticals Inc. (VNDA) Bundle
Ganhe domínio sobre sua análise de avaliação da Vanda Pharmaceuticals Inc. (VNDA) com nossa calculadora DCF de última geração! Equipado com dados reais da VNDA, este modelo do Excel permite ajustar as previsões e suposições para determinar com precisão o valor intrínseco da Vanda Pharmaceuticals Inc.
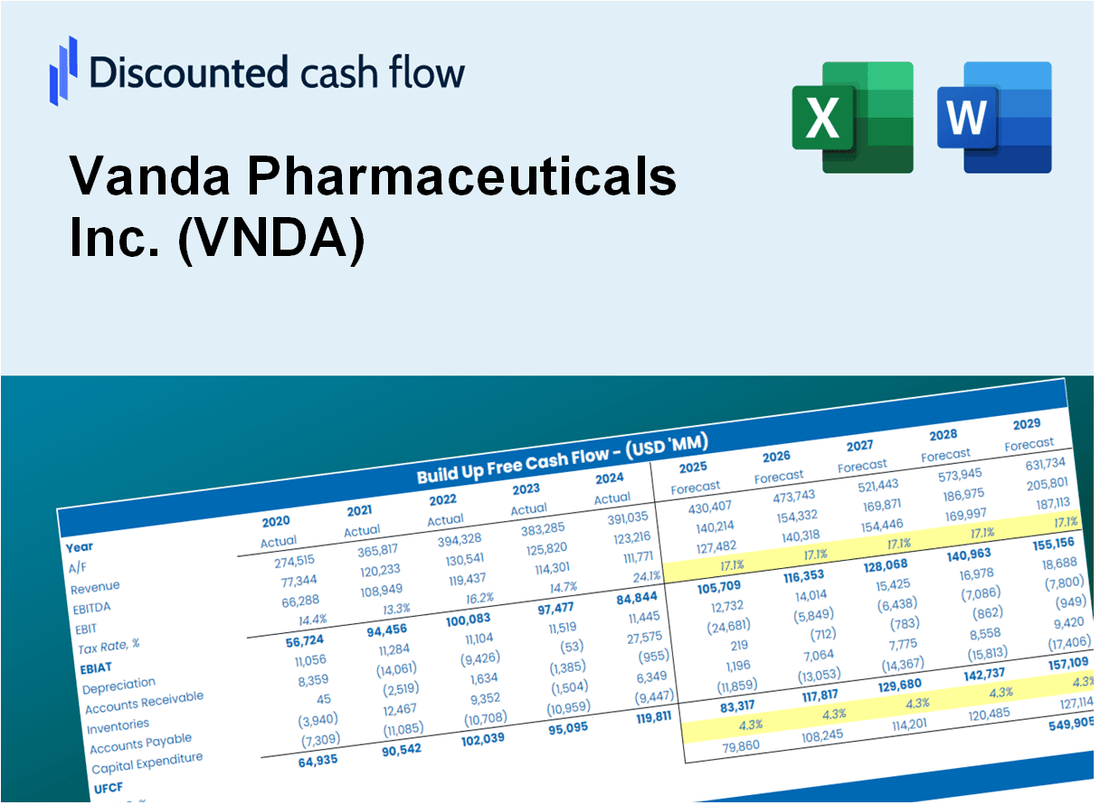
Discounted Cash Flow (DCF) - (USD MM)
| Year | AY1 2020 |
AY2 2021 |
AY3 2022 |
AY4 2023 |
AY5 2024 |
FY1 2025 |
FY2 2026 |
FY3 2027 |
FY4 2028 |
FY5 2029 |
|---|---|---|---|---|---|---|---|---|---|---|
| Revenue | 248.2 | 268.7 | 254.4 | 192.6 | 198.8 | 189.8 | 181.1 | 172.9 | 165.1 | 157.6 |
| Revenue Growth, % | 0 | 8.27 | -5.32 | -24.27 | 3.18 | -4.54 | -4.54 | -4.54 | -4.54 | -4.54 |
| EBITDA | 34.5 | 45.0 | 9.1 | -10.9 | -32.5 | 4.6 | 4.4 | 4.2 | 4.0 | 3.8 |
| EBITDA, % | 13.91 | 16.75 | 3.56 | -5.68 | -16.36 | 2.44 | 2.44 | 2.44 | 2.44 | 2.44 |
| Depreciation | 2.9 | 2.8 | 2.7 | 3.0 | 8.1 | 3.4 | 3.2 | 3.1 | 3.0 | 2.8 |
| Depreciation, % | 1.15 | 1.06 | 1.07 | 1.56 | 4.09 | 1.79 | 1.79 | 1.79 | 1.79 | 1.79 |
| EBIT | 31.7 | 42.2 | 6.3 | -14.0 | -40.7 | 1.2 | 1.2 | 1.1 | 1.1 | 1.0 |
| EBIT, % | 12.76 | 15.69 | 2.49 | -7.24 | -20.46 | 0.64772 | 0.64772 | 0.64772 | 0.64772 | 0.64772 |
| Total Cash | 367.7 | 432.8 | 466.9 | 388.3 | 374.6 | 189.8 | 181.1 | 172.9 | 165.1 | 157.6 |
| Total Cash, percent | .0 | .0 | .0 | .0 | .0 | .0 | .0 | .0 | .0 | .0 |
| Account Receivables | 30.0 | 32.5 | 33.5 | 34.2 | 47.1 | 29.9 | 28.5 | 27.2 | 26.0 | 24.8 |
| Account Receivables, % | 12.1 | 12.08 | 13.17 | 17.73 | 23.7 | 15.76 | 15.76 | 15.76 | 15.76 | 15.76 |
| Inventories | 1.3 | 1.0 | 1.2 | 1.4 | 1.7 | 1.1 | 1.1 | 1.0 | 1.0 | .9 |
| Inventories, % | 0.51578 | 0.38149 | 0.46937 | 0.70442 | 0.86833 | 0.58788 | 0.58788 | 0.58788 | 0.58788 | 0.58788 |
| Accounts Payable | 1.0 | .9 | 12.7 | 7.1 | 3.5 | 4.3 | 4.1 | 3.9 | 3.7 | 3.5 |
| Accounts Payable, % | 0.4227 | 0.34427 | 4.99 | 3.71 | 1.76 | 2.24 | 2.24 | 2.24 | 2.24 | 2.24 |
| Capital Expenditure | -1.8 | -.6 | -.7 | -.4 | -.5 | -.6 | -.6 | -.6 | -.5 | -.5 |
| Capital Expenditure, % | -0.7233 | -0.20545 | -0.26692 | -0.19882 | -0.24651 | -0.3282 | -0.3282 | -0.3282 | -0.3282 | -0.3282 |
| Tax Rate, % | 17.54 | 17.54 | 17.54 | 17.54 | 17.54 | 17.54 | 17.54 | 17.54 | 17.54 | 17.54 |
| EBITAT | 23.3 | 33.0 | 3.5 | -5.5 | -33.5 | .8 | .8 | .7 | .7 | .7 |
| Depreciation | ||||||||||
| Changes in Account Receivables | ||||||||||
| Changes in Inventories | ||||||||||
| Changes in Accounts Payable | ||||||||||
| Capital Expenditure | ||||||||||
| UFCF | -5.9 | 33.0 | 16.1 | -9.2 | -42.8 | 22.2 | 4.6 | 4.4 | 4.2 | 4.0 |
| WACC, % | 6.89 | 6.9 | 6.86 | 6.83 | 6.9 | 6.88 | 6.88 | 6.88 | 6.88 | 6.88 |
| PV UFCF | ||||||||||
| SUM PV UFCF | 34.5 | |||||||||
| Long Term Growth Rate, % | 4.00 | |||||||||
| Free cash flow (T + 1) | 4 | |||||||||
| Terminal Value | 146 | |||||||||
| Present Terminal Value | 104 | |||||||||
| Enterprise Value | 139 | |||||||||
| Net Debt | -90 | |||||||||
| Equity Value | 229 | |||||||||
| Diluted Shares Outstanding, MM | 58 | |||||||||
| Equity Value Per Share | 3.94 |
What You Will Get
- Real VNDA Financial Data: Pre-filled with Vanda Pharmaceuticals’ historical and projected data for precise analysis.
- Fully Editable Template: Easily modify key inputs such as revenue growth, WACC, and EBITDA %.
- Automatic Calculations: Instantly see Vanda Pharmaceuticals’ intrinsic value update based on your adjustments.
- Professional Valuation Tool: Tailored for investors, analysts, and consultants looking for accurate DCF results.
- User-Friendly Design: A straightforward structure and clear instructions suitable for all experience levels.
Key Features
- Comprehensive Data: Vanda Pharmaceuticals Inc.'s historical financial statements and pre-filled projections.
- Customizable Inputs: Modify WACC, tax rates, revenue growth, and EBITDA margins as needed.
- Real-Time Updates: View Vanda Pharmaceuticals Inc.'s intrinsic value recalculating instantly.
- Intuitive Visual Outputs: Dashboard charts showcase valuation results and essential metrics.
- Designed for Precision: A reliable tool tailored for analysts, investors, and finance professionals.
How It Works
- Step 1: Download the Excel file.
- Step 2: Review pre-entered Vanda Pharmaceuticals Inc. (VNDA) data (historical and projected).
- Step 3: Adjust key assumptions (yellow cells) based on your analysis.
- Step 4: View automatic recalculations for Vanda Pharmaceuticals Inc. (VNDA)’s intrinsic value.
- Step 5: Use the outputs for investment decisions or reporting.
Why Choose Vanda Pharmaceuticals Inc. (VNDA)?
- Innovative Solutions: Pioneering treatments that address unmet medical needs.
- Proven Track Record: A history of successful product development and market introduction.
- Patient-Centric Approach: Focused on improving the quality of life for patients.
- Strong Research Pipeline: Committed to advancing science through ongoing research and development.
- Expert Team: Led by experienced professionals dedicated to pharmaceutical excellence.
Who Should Use This Product?
- Professional Investors: Develop comprehensive and accurate valuation models for assessing Vanda Pharmaceuticals Inc. (VNDA).
- Corporate Finance Teams: Evaluate valuation scenarios to inform strategic decisions within the organization.
- Consultants and Advisors: Deliver precise valuation insights to clients regarding Vanda Pharmaceuticals Inc. (VNDA).
- Students and Educators: Utilize real-time data to enhance learning and practice in financial modeling.
- Healthcare Sector Enthusiasts: Gain insights into how pharmaceutical companies like Vanda Pharmaceuticals Inc. (VNDA) are valued in the market.
What the Template Contains
- Pre-Filled DCF Model: Vanda Pharmaceuticals’ financial data preloaded for immediate use.
- WACC Calculator: Detailed calculations for Weighted Average Cost of Capital.
- Financial Ratios: Evaluate Vanda Pharmaceuticals’ profitability, leverage, and efficiency.
- Editable Inputs: Change assumptions such as growth, margins, and CAPEX to fit your scenarios.
- Financial Statements: Annual and quarterly reports to support detailed analysis.
- Interactive Dashboard: Easily visualize key valuation metrics and results.
Disclaimer
All information, articles, and product details provided on this website are for general informational and educational purposes only. We do not claim any ownership over, nor do we intend to infringe upon, any trademarks, copyrights, logos, brand names, or other intellectual property mentioned or depicted on this site. Such intellectual property remains the property of its respective owners, and any references here are made solely for identification or informational purposes, without implying any affiliation, endorsement, or partnership.
We make no representations or warranties, express or implied, regarding the accuracy, completeness, or suitability of any content or products presented. Nothing on this website should be construed as legal, tax, investment, financial, medical, or other professional advice. In addition, no part of this site—including articles or product references—constitutes a solicitation, recommendation, endorsement, advertisement, or offer to buy or sell any securities, franchises, or other financial instruments, particularly in jurisdictions where such activity would be unlawful.
All content is of a general nature and may not address the specific circumstances of any individual or entity. It is not a substitute for professional advice or services. Any actions you take based on the information provided here are strictly at your own risk. You accept full responsibility for any decisions or outcomes arising from your use of this website and agree to release us from any liability in connection with your use of, or reliance upon, the content or products found herein.