
|
VONTIER CORPORATION (VNT) DCF Avaliação |
Totalmente Editável: Adapte-Se Às Suas Necessidades No Excel Ou Planilhas
Design Profissional: Modelos Confiáveis E Padrão Da Indústria
Pré-Construídos Para Uso Rápido E Eficiente
Compatível com MAC/PC, totalmente desbloqueado
Não É Necessária Experiência; Fácil De Seguir
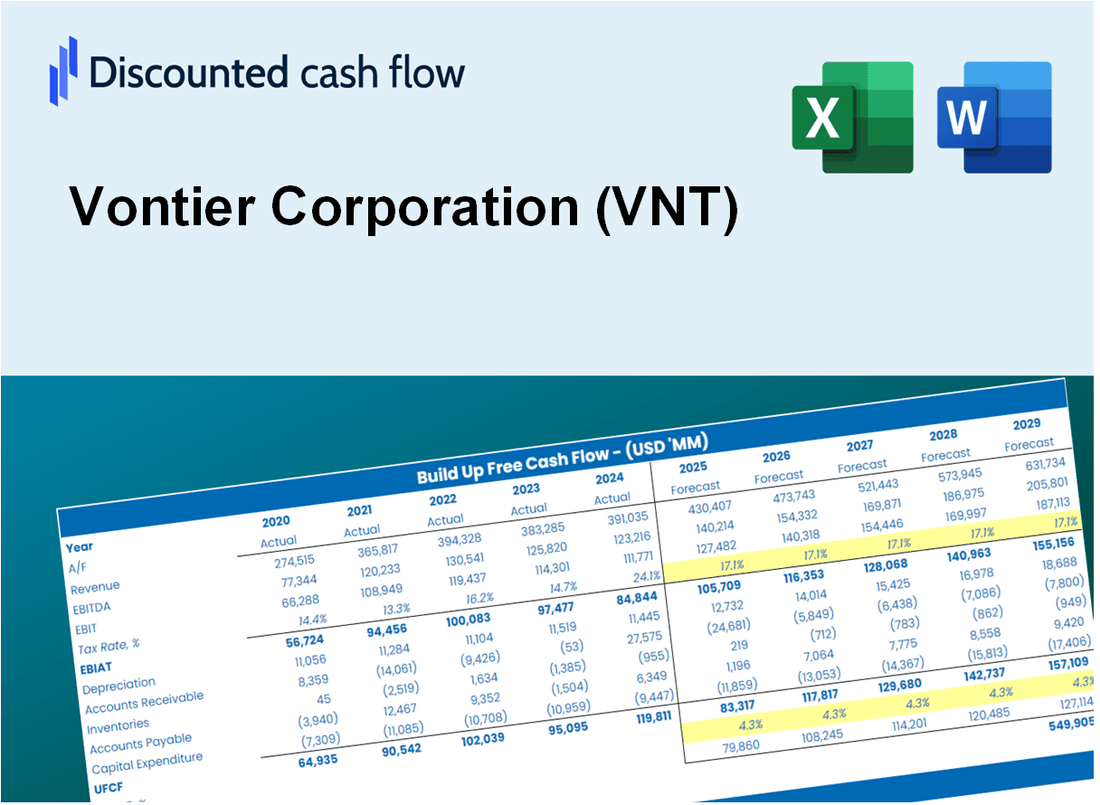
Vontier Corporation (VNT) Bundle
Procurando avaliar o valor intrínseco da Vontier Corporation? Nossa calculadora DCF (VNT) integra dados do mundo real com extensos recursos de personalização, permitindo refinar suas previsões e aprimorar suas opções de investimento.
What You Will Receive
- Flexible Forecast Inputs: Modify key assumptions (growth %, profit margins, WACC) to explore various scenarios.
- Comprehensive Data: Vontier Corporation’s financial information pre-loaded to facilitate your analysis.
- Automated DCF Calculations: The template computes Net Present Value (NPV) and intrinsic value automatically.
- Tailored and Professional: A refined Excel model designed to meet your valuation requirements.
- Designed for Analysts and Investors: Perfect for evaluating projections, confirming strategies, and enhancing efficiency.
Key Features
- Comprehensive Financial Data: Vontier Corporation's historical financial statements and pre-filled projections.
- Customizable Parameters: Modify WACC, tax rates, revenue growth, and EBITDA margins to suit your analysis.
- Real-Time Valuation: Instantly view Vontier Corporation's intrinsic value as it updates live.
- Intuitive Visualizations: Dashboard graphs illustrate valuation outcomes and essential metrics clearly.
- Designed for Precision: A reliable tool tailored for analysts, investors, and finance professionals.
How It Works
- Download the Template: Gain immediate access to the Excel-based VNT DCF Calculator.
- Input Your Assumptions: Modify the yellow-highlighted cells for growth rates, WACC, margins, and additional variables.
- Instant Calculations: The model will automatically refresh Vontier Corporation’s intrinsic value.
- Test Scenarios: Experiment with different assumptions to assess potential changes in valuation.
- Analyze and Decide: Utilize the outcomes to inform your investment or financial decisions.
Why Choose This Calculator for Vontier Corporation (VNT)?
- All-in-One Solution: Combines DCF, WACC, and financial ratio analyses tailored for Vontier Corporation.
- Flexible Inputs: Modify the yellow-highlighted fields to explore different financial scenarios.
- In-Depth Analysis: Automatically computes Vontier's intrinsic value and Net Present Value.
- Data-Rich Environment: Historical and projected data provide reliable starting points for analysis.
- Expert-Level Utility: Perfect for financial analysts, investors, and business consultants focusing on Vontier Corporation.
Who Should Use This Product?
- Professional Investors: Create comprehensive and accurate valuation models for portfolio management related to Vontier Corporation (VNT).
- Corporate Finance Teams: Evaluate valuation scenarios to inform strategic decisions within the organization.
- Consultants and Advisors: Deliver precise valuation insights for clients interested in Vontier Corporation (VNT).
- Students and Educators: Utilize real-world data for practicing and teaching financial modeling techniques.
- Industry Analysts: Gain insights into how companies like Vontier Corporation (VNT) are valued in the marketplace.
What the Template Contains
- Operating and Balance Sheet Data: Pre-filled Vontier Corporation (VNT) historical data and forecasts, including revenue, EBITDA, EBIT, and capital expenditures.
- WACC Calculation: A dedicated sheet for Weighted Average Cost of Capital (WACC), including parameters like Beta, risk-free rate, and share price.
- DCF Valuation (Unlevered and Levered): Editable Discounted Cash Flow models showing intrinsic value with detailed calculations.
- Financial Statements: Pre-loaded financial statements (annual and quarterly) to support analysis.
- Key Ratios: Includes profitability, leverage, and efficiency ratios for Vontier Corporation (VNT).
- Dashboard and Charts: Visual summary of valuation outputs and assumptions to analyze results easily.
Disclaimer
All information, articles, and product details provided on this website are for general informational and educational purposes only. We do not claim any ownership over, nor do we intend to infringe upon, any trademarks, copyrights, logos, brand names, or other intellectual property mentioned or depicted on this site. Such intellectual property remains the property of its respective owners, and any references here are made solely for identification or informational purposes, without implying any affiliation, endorsement, or partnership.
We make no representations or warranties, express or implied, regarding the accuracy, completeness, or suitability of any content or products presented. Nothing on this website should be construed as legal, tax, investment, financial, medical, or other professional advice. In addition, no part of this site—including articles or product references—constitutes a solicitation, recommendation, endorsement, advertisement, or offer to buy or sell any securities, franchises, or other financial instruments, particularly in jurisdictions where such activity would be unlawful.
All content is of a general nature and may not address the specific circumstances of any individual or entity. It is not a substitute for professional advice or services. Any actions you take based on the information provided here are strictly at your own risk. You accept full responsibility for any decisions or outcomes arising from your use of this website and agree to release us from any liability in connection with your use of, or reliance upon, the content or products found herein.