
|
Viridian Therapeutics, Inc. (VRDN) Avaliação DCF |
Totalmente Editável: Adapte-Se Às Suas Necessidades No Excel Ou Planilhas
Design Profissional: Modelos Confiáveis E Padrão Da Indústria
Pré-Construídos Para Uso Rápido E Eficiente
Compatível com MAC/PC, totalmente desbloqueado
Não É Necessária Experiência; Fácil De Seguir
Viridian Therapeutics, Inc. (VRDN) Bundle
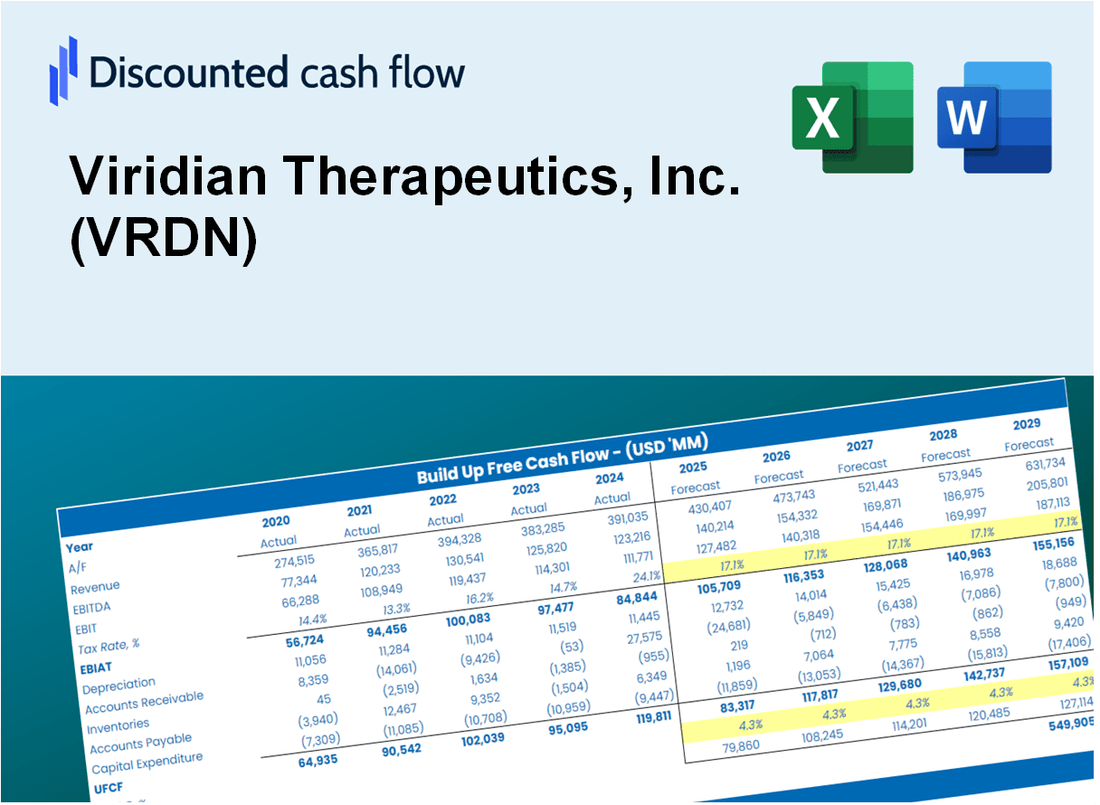
Seja você um investidor ou analista, esta calculadora DCF (VRDN) é o seu recurso preferido para uma avaliação precisa. Apresentando dados reais da Viridian Therapeutics, Inc., você pode ajustar as previsões e observar os efeitos em tempo real.
What You Will Get
- Editable Forecast Inputs: Adjust key assumptions (growth %, margins, WACC) effortlessly to explore various scenarios.
- Real-World Data: Viridian Therapeutics, Inc. (VRDN) financial data pre-loaded to kickstart your analysis.
- Automatic DCF Outputs: The template computes Net Present Value (NPV) and intrinsic value automatically.
- Customizable and Professional: A refined Excel model that tailors to your valuation requirements.
- Built for Analysts and Investors: Perfect for evaluating projections, confirming strategies, and enhancing efficiency.
Key Features
- Comprehensive DCF Calculator: Provides detailed unlevered and levered DCF valuation models tailored for Viridian Therapeutics, Inc. (VRDN).
- WACC Calculator: Features a pre-built Weighted Average Cost of Capital sheet with options for customizable inputs.
- Customizable Forecast Assumptions: Adjust growth rates, capital expenditures, and discount rates to fit your analysis.
- Integrated Financial Ratios: Evaluate profitability, leverage, and efficiency ratios specific to Viridian Therapeutics, Inc. (VRDN).
- Interactive Dashboard and Charts: Visual representations summarize essential valuation metrics for straightforward analysis.
How It Works
- Download the Template: Get instant access to the Excel-based VRDN DCF Calculator.
- Input Your Assumptions: Adjust yellow-highlighted cells for growth rates, WACC, margins, and more.
- Instant Calculations: The model automatically updates Viridian Therapeutics’ intrinsic value.
- Test Scenarios: Simulate different assumptions to evaluate potential valuation changes.
- Analyze and Decide: Use the results to guide your investment or financial analysis.
Why Choose This Calculator for Viridian Therapeutics, Inc. (VRDN)?
- Designed for Experts: A sophisticated tool utilized by biopharma analysts, investors, and financial advisors.
- Comprehensive Data: Viridian's historical and projected financials are preloaded for reliable analysis.
- Flexible Scenario Analysis: Easily test various forecasts and assumptions to evaluate potential outcomes.
- Insightful Outputs: Automatically computes intrinsic value, NPV, and essential financial metrics.
- User-Friendly: Step-by-step guidance ensures a smooth and efficient experience.
Who Should Use This Product?
- Investors: Accurately assess Viridian Therapeutics’ fair value before making investment decisions.
- CFOs: Utilize a professional-grade DCF model for financial reporting and analysis related to Viridian Therapeutics (VRDN).
- Consultants: Easily customize the template for valuation reports tailored to clients interested in Viridian Therapeutics (VRDN).
- Entrepreneurs: Acquire insights into financial modeling practices employed by leading biotech companies.
- Educators: Implement it as a teaching resource to illustrate valuation methodologies in the biotechnology sector.
What the Template Contains
- Pre-Filled Data: Includes Viridian Therapeutics' historical financials and projections.
- Discounted Cash Flow Model: Editable DCF valuation model featuring automatic calculations.
- Weighted Average Cost of Capital (WACC): A dedicated sheet for determining WACC based on customized inputs.
- Key Financial Ratios: Assess Viridian Therapeutics' profitability, efficiency, and leverage metrics.
- Customizable Inputs: Easily modify revenue growth, margins, and tax rates.
- Clear Dashboard: Visual representations and tables summarizing essential valuation outcomes.
Disclaimer
All information, articles, and product details provided on this website are for general informational and educational purposes only. We do not claim any ownership over, nor do we intend to infringe upon, any trademarks, copyrights, logos, brand names, or other intellectual property mentioned or depicted on this site. Such intellectual property remains the property of its respective owners, and any references here are made solely for identification or informational purposes, without implying any affiliation, endorsement, or partnership.
We make no representations or warranties, express or implied, regarding the accuracy, completeness, or suitability of any content or products presented. Nothing on this website should be construed as legal, tax, investment, financial, medical, or other professional advice. In addition, no part of this site—including articles or product references—constitutes a solicitation, recommendation, endorsement, advertisement, or offer to buy or sell any securities, franchises, or other financial instruments, particularly in jurisdictions where such activity would be unlawful.
All content is of a general nature and may not address the specific circumstances of any individual or entity. It is not a substitute for professional advice or services. Any actions you take based on the information provided here are strictly at your own risk. You accept full responsibility for any decisions or outcomes arising from your use of this website and agree to release us from any liability in connection with your use of, or reliance upon, the content or products found herein.