
|
Versus Systems Inc. (VS) Avaliação DCF |
Totalmente Editável: Adapte-Se Às Suas Necessidades No Excel Ou Planilhas
Design Profissional: Modelos Confiáveis E Padrão Da Indústria
Pré-Construídos Para Uso Rápido E Eficiente
Compatível com MAC/PC, totalmente desbloqueado
Não É Necessária Experiência; Fácil De Seguir
Versus Systems Inc. (VS) Bundle
Explore as perspectivas financeiras da Versus Systems Inc. (VS) com nossa calculadora DCF amigável! Digite suas suposições sobre crescimento, margens e despesas para calcular o valor intrínseco da Versus Systems Inc. (vs) e aprimorar sua estratégia de investimento.
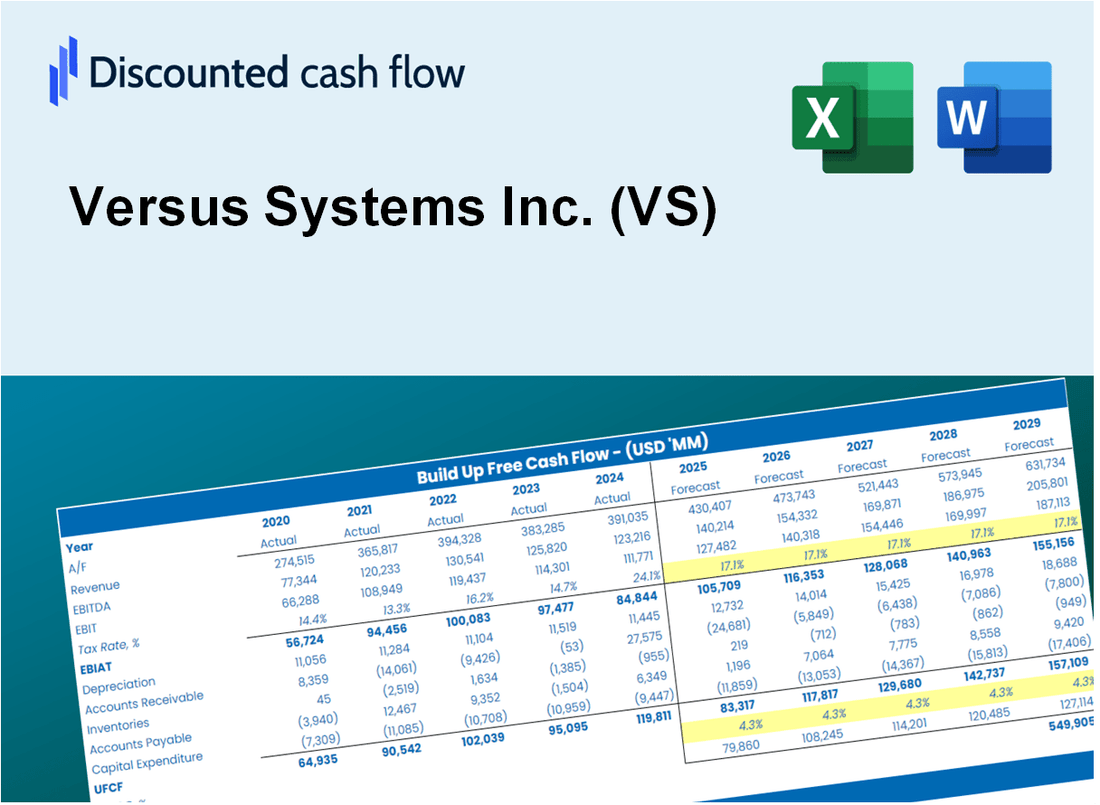
Discounted Cash Flow (DCF) - (USD MM)
| Year | AY1 2020 |
AY2 2021 |
AY3 2022 |
AY4 2023 |
AY5 2024 |
FY1 2025 |
FY2 2026 |
FY3 2027 |
FY4 2028 |
FY5 2029 |
|---|---|---|---|---|---|---|---|---|---|---|
| Revenue | 1.0 | .7 | 1.1 | .3 | .1 | .0 | .0 | .0 | .0 | .0 |
| Revenue Growth, % | 0 | -29.52 | 52.09 | -75.88 | -77.08 | -32.6 | -32.6 | -32.6 | -32.6 | -32.6 |
| EBITDA | -3.7 | -13.9 | -10.3 | -3.8 | -4.7 | .0 | .0 | .0 | .0 | .0 |
| EBITDA, % | -370.19 | -1996.89 | -966.9 | -1497.86 | -7920.57 | -100 | -100 | -100 | -100 | -100 |
| Depreciation | 1.1 | 2.1 | 2.9 | 2.3 | .0 | .0 | .0 | .0 | .0 | .0 |
| Depreciation, % | 110.16 | 305.13 | 273.35 | 910.21 | 2.95 | 80.59 | 80.59 | 80.59 | 80.59 | 80.59 |
| EBIT | -4.8 | -16.1 | -13.2 | -6.2 | -4.7 | .0 | .0 | .0 | .0 | .0 |
| EBIT, % | -480.35 | -2302.02 | -1240.25 | -2408.07 | -7923.52 | -100 | -100 | -100 | -100 | -100 |
| Total Cash | 1.7 | 1.2 | .8 | 3.3 | 2.2 | .0 | .0 | .0 | .0 | .0 |
| Total Cash, percent | .0 | .0 | .0 | .0 | .0 | .0 | .0 | .0 | .0 | .0 |
| Account Receivables | .3 | .1 | .0 | .0 | .0 | .0 | .0 | .0 | .0 | .0 |
| Account Receivables, % | 33.44 | 12.62 | 4.08 | 5.07 | 0 | 11.04 | 11.04 | 11.04 | 11.04 | 11.04 |
| Inventories | .0 | .0 | .0 | .0 | .0 | .0 | .0 | .0 | .0 | .0 |
| Inventories, % | 0 | 0 | 0 | 0 | 0 | 0 | 0 | 0 | 0 | 0 |
| Accounts Payable | .4 | .3 | .1 | .1 | .0 | .0 | .0 | .0 | .0 | .0 |
| Accounts Payable, % | 39.74 | 39.41 | 9.28 | 22.97 | 31.91 | 28.66 | 28.66 | 28.66 | 28.66 | 28.66 |
| Capital Expenditure | -.8 | -1.7 | -1.8 | .0 | .0 | .0 | .0 | .0 | .0 | .0 |
| Capital Expenditure, % | -79.65 | -247.72 | -170.27 | -5.4 | 0 | -57.01 | -57.01 | -57.01 | -57.01 | -57.01 |
| Tax Rate, % | 11.17 | 11.17 | 11.17 | 11.17 | 11.17 | 11.17 | 11.17 | 11.17 | 11.17 | 11.17 |
| EBITAT | -4.8 | -16.1 | -13.2 | -5.6 | -4.1 | .0 | .0 | .0 | .0 | .0 |
| Depreciation | ||||||||||
| Changes in Account Receivables | ||||||||||
| Changes in Inventories | ||||||||||
| Changes in Accounts Payable | ||||||||||
| Capital Expenditure | ||||||||||
| UFCF | -4.4 | -15.5 | -12.2 | -3.3 | -4.2 | .0 | .0 | .0 | .0 | .0 |
| WACC, % | 13.12 | 13.12 | 13.12 | 13.12 | 13.12 | 13.12 | 13.12 | 13.12 | 13.12 | 13.12 |
| PV UFCF | ||||||||||
| SUM PV UFCF | -.1 | |||||||||
| Long Term Growth Rate, % | 2.00 | |||||||||
| Free cash flow (T + 1) | 0 | |||||||||
| Terminal Value | 0 | |||||||||
| Present Terminal Value | 0 | |||||||||
| Enterprise Value | 0 | |||||||||
| Net Debt | -2 | |||||||||
| Equity Value | 2 | |||||||||
| Diluted Shares Outstanding, MM | 3 | |||||||||
| Equity Value Per Share | 0.79 |
What You Will Get
- Editable Forecast Inputs: Easily modify key assumptions (growth %, margins, WACC) to generate various scenarios.
- Real-World Data: Versus Systems Inc. (VS) financial data pre-filled to kickstart your analysis.
- Automatic DCF Outputs: The template computes Net Present Value (NPV) and intrinsic value automatically.
- Customizable and Professional: A sleek Excel model that adjusts to your valuation requirements.
- Built for Analysts and Investors: Perfect for testing projections, validating strategies, and enhancing efficiency.
Key Features
- Comprehensive Financial Data: Gain access to reliable pre-loaded historical figures and future forecasts for Versus Systems Inc. (VS).
- Adjustable Forecast Parameters: Modify highlighted fields such as WACC, growth rates, and profit margins to suit your analysis.
- Real-Time Calculations: Automatic recalculations for DCF, Net Present Value (NPV), and cash flow assessments.
- User-Friendly Dashboard: Intuitive charts and summaries to help you easily interpret your valuation findings.
- Designed for All Skill Levels: A straightforward, user-centric layout tailored for investors, CFOs, and consultants alike.
How It Works
- Step 1: Download the Excel file for Versus Systems Inc. (VS).
- Step 2: Review the pre-filled financial data and forecasts for Versus Systems Inc. (VS).
- Step 3: Adjust key inputs such as revenue growth, WACC, and tax rates (highlighted cells).
- Step 4: Observe the DCF model update in real-time as you modify your assumptions.
- Step 5: Evaluate the outputs and utilize the results for your investment strategies.
Why Choose Versus Systems Inc. (VS) Calculator?
- All-in-One Solution: Combines DCF, WACC, and financial ratio analyses seamlessly.
- Flexible Inputs: Modify yellow-highlighted fields to explore different financial scenarios.
- In-Depth Analysis: Automatically computes Versus Systems' intrinsic value and Net Present Value.
- Preloaded Information: Access to historical and projected data for reliable calculations.
- High-Quality Standards: Perfect for financial analysts, investors, and business advisors.
Who Should Use Versus Systems Inc. (VS)?
- Investors: Gain insights into innovative gaming technology and make informed investment choices.
- Game Developers: Leverage the platform to enhance user engagement through interactive rewards.
- Marketers: Utilize the tools for creating compelling promotional campaigns that drive user participation.
- Tech Enthusiasts: Explore cutting-edge advancements in the gaming industry and their market implications.
- Educators and Students: Incorporate real-world applications of technology in gaming into your curriculum.
What the Template Contains
- Comprehensive DCF Model: Editable template with detailed valuation calculations for Versus Systems Inc. (VS).
- Real-World Data: Versus Systems Inc.'s historical and projected financials preloaded for analysis.
- Customizable Parameters: Adjust WACC, growth rates, and tax assumptions to test various scenarios for Versus Systems Inc. (VS).
- Financial Statements: Full annual and quarterly breakdowns for deeper insights into Versus Systems Inc. (VS).
- Key Ratios: Built-in analysis for profitability, efficiency, and leverage specific to Versus Systems Inc. (VS).
- Dashboard with Visual Outputs: Charts and tables for clear, actionable results related to Versus Systems Inc. (VS).
Disclaimer
All information, articles, and product details provided on this website are for general informational and educational purposes only. We do not claim any ownership over, nor do we intend to infringe upon, any trademarks, copyrights, logos, brand names, or other intellectual property mentioned or depicted on this site. Such intellectual property remains the property of its respective owners, and any references here are made solely for identification or informational purposes, without implying any affiliation, endorsement, or partnership.
We make no representations or warranties, express or implied, regarding the accuracy, completeness, or suitability of any content or products presented. Nothing on this website should be construed as legal, tax, investment, financial, medical, or other professional advice. In addition, no part of this site—including articles or product references—constitutes a solicitation, recommendation, endorsement, advertisement, or offer to buy or sell any securities, franchises, or other financial instruments, particularly in jurisdictions where such activity would be unlawful.
All content is of a general nature and may not address the specific circumstances of any individual or entity. It is not a substitute for professional advice or services. Any actions you take based on the information provided here are strictly at your own risk. You accept full responsibility for any decisions or outcomes arising from your use of this website and agree to release us from any liability in connection with your use of, or reliance upon, the content or products found herein.