
|
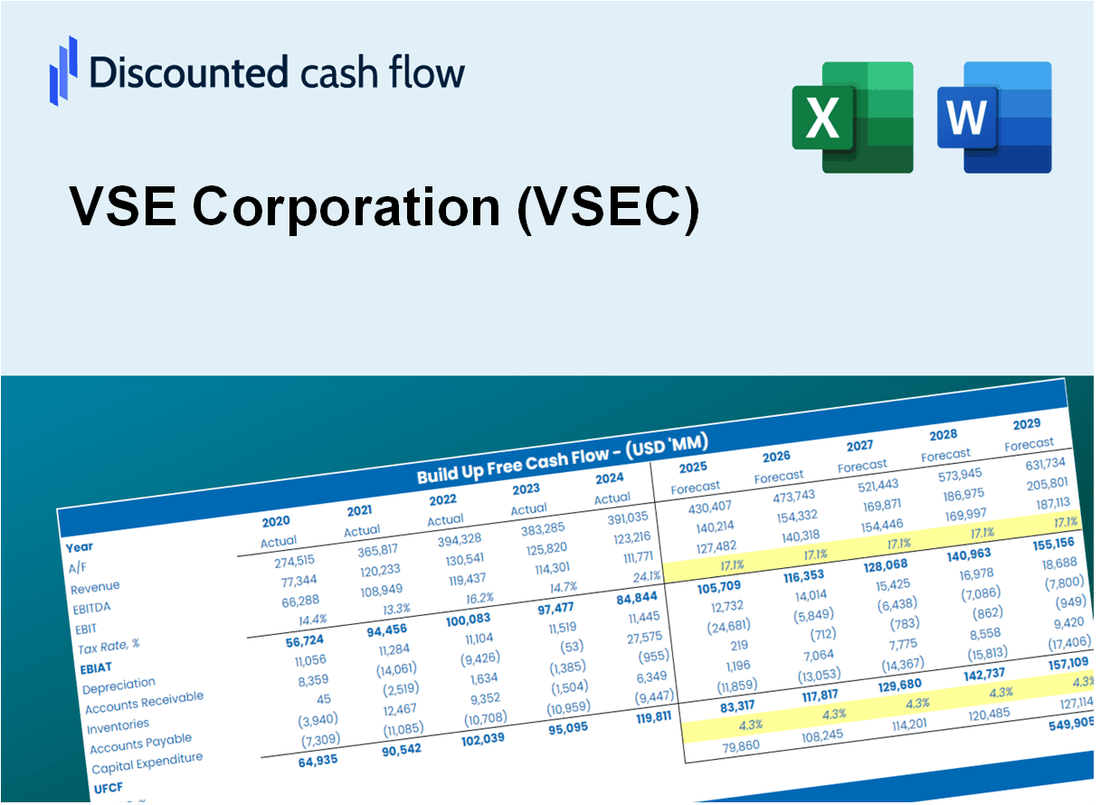
Avaliação DCF da VSE Corporation (VSEC) |
Totalmente Editável: Adapte-Se Às Suas Necessidades No Excel Ou Planilhas
Design Profissional: Modelos Confiáveis E Padrão Da Indústria
Pré-Construídos Para Uso Rápido E Eficiente
Compatível com MAC/PC, totalmente desbloqueado
Não É Necessária Experiência; Fácil De Seguir
VSE Corporation (VSEC) Bundle
Explore o potencial financeiro da VSE Corporation (VSEC) com nossa calculadora DCF! Digite suas suposições sobre crescimento, margens e despesas para calcular o valor intrínseco da VSE Corporation (VSEC) e moldar sua abordagem de investimento.
Discounted Cash Flow (DCF) - (USD MM)
| Year | AY1 2020 |
AY2 2021 |
AY3 2022 |
AY4 2023 |
AY5 2024 |
FY1 2025 |
FY2 2026 |
FY3 2027 |
FY4 2028 |
FY5 2029 |
|---|---|---|---|---|---|---|---|---|---|---|
| Revenue | 661.7 | 750.9 | 669.4 | 860.5 | 1,080.1 | 1,233.2 | 1,408.1 | 1,607.7 | 1,835.5 | 2,095.7 |
| Revenue Growth, % | 0 | 13.48 | -10.84 | 28.54 | 25.53 | 14.18 | 14.18 | 14.18 | 14.18 | 14.18 |
| EBITDA | 38.1 | 47.1 | 78.2 | 111.4 | 110.2 | 115.6 | 132.0 | 150.7 | 172.0 | 196.4 |
| EBITDA, % | 5.75 | 6.28 | 11.68 | 12.95 | 10.2 | 9.37 | 9.37 | 9.37 | 9.37 | 9.37 |
| Depreciation | 24.1 | 25.6 | 24.6 | 23.4 | 28.8 | 39.8 | 45.4 | 51.8 | 59.2 | 67.6 |
| Depreciation, % | 3.65 | 3.41 | 3.67 | 2.72 | 2.66 | 3.22 | 3.22 | 3.22 | 3.22 | 3.22 |
| EBIT | 13.9 | 21.5 | 53.6 | 88.0 | 81.4 | 75.8 | 86.6 | 98.8 | 112.9 | 128.9 |
| EBIT, % | 2.1 | 2.87 | 8.01 | 10.23 | 7.54 | 6.15 | 6.15 | 6.15 | 6.15 | 6.15 |
| Total Cash | .4 | .5 | .3 | 7.8 | 29.0 | 9.3 | 10.6 | 12.1 | 13.8 | 15.8 |
| Total Cash, percent | .0 | .0 | .0 | .0 | .0 | .0 | .0 | .0 | .0 | .0 |
| Account Receivables | 80.6 | 111.3 | 98.0 | 136.0 | 227.5 | 193.6 | 221.1 | 252.4 | 288.2 | 329.1 |
| Account Receivables, % | 12.17 | 14.82 | 14.64 | 15.81 | 21.06 | 15.7 | 15.7 | 15.7 | 15.7 | 15.7 |
| Inventories | 253.4 | 322.7 | 380.7 | 500.9 | 576.3 | 615.9 | 703.2 | 802.9 | 916.7 | 1,046.7 |
| Inventories, % | 38.3 | 42.98 | 56.87 | 58.21 | 53.36 | 49.94 | 49.94 | 49.94 | 49.94 | 49.94 |
| Accounts Payable | 72.7 | 115.1 | 128.5 | 173.0 | 187.6 | 204.7 | 233.7 | 266.8 | 304.6 | 347.8 |
| Accounts Payable, % | 10.98 | 15.32 | 19.2 | 20.11 | 17.37 | 16.6 | 16.6 | 16.6 | 16.6 | 16.6 |
| Capital Expenditure | -4.4 | -10.5 | -11.2 | -18.7 | -20.7 | -19.3 | -22.1 | -25.2 | -28.7 | -32.8 |
| Capital Expenditure, % | -0.66908 | -1.4 | -1.67 | -2.17 | -1.92 | -1.57 | -1.57 | -1.57 | -1.57 | -1.57 |
| Tax Rate, % | 34.33 | 34.33 | 34.33 | 34.33 | 34.33 | 34.33 | 34.33 | 34.33 | 34.33 | 34.33 |
| EBITAT | -168.6 | 18.1 | 42.1 | 60.5 | 53.5 | 45.1 | 51.5 | 58.8 | 67.1 | 76.6 |
| Depreciation | ||||||||||
| Changes in Account Receivables | ||||||||||
| Changes in Inventories | ||||||||||
| Changes in Accounts Payable | ||||||||||
| Capital Expenditure | ||||||||||
| UFCF | -410.2 | -24.4 | 24.2 | -48.4 | -90.9 | 76.9 | -10.9 | -12.5 | -14.3 | -16.3 |
| WACC, % | 8.95 | 9.74 | 9.68 | 9.59 | 9.56 | 9.5 | 9.5 | 9.5 | 9.5 | 9.5 |
| PV UFCF | ||||||||||
| SUM PV UFCF | 31.3 | |||||||||
| Long Term Growth Rate, % | 2.00 | |||||||||
| Free cash flow (T + 1) | -17 | |||||||||
| Terminal Value | -221 | |||||||||
| Present Terminal Value | -141 | |||||||||
| Enterprise Value | -109 | |||||||||
| Net Debt | 456 | |||||||||
| Equity Value | -565 | |||||||||
| Diluted Shares Outstanding, MM | 18 | |||||||||
| Equity Value Per Share | -31.45 |
What You Will Get
- Editable Excel Template: A fully customizable Excel-based DCF Calculator featuring pre-filled real VSEC financials.
- Real-World Data: Access to historical data and forward-looking estimates (highlighted in the yellow cells).
- Forecast Flexibility: Adjust forecast assumptions such as revenue growth, EBITDA %, and WACC.
- Automatic Calculations: Quickly observe how your inputs affect VSE Corporation’s valuation.
- Professional Tool: Designed for investors, CFOs, consultants, and financial analysts.
- User-Friendly Design: Organized for clarity and ease of use, complete with step-by-step instructions.
Key Features
- 🔍 Real-Life VSEC Financials: Pre-filled historical and projected data for VSE Corporation (VSEC).
- ✏️ Fully Customizable Inputs: Adjust all critical parameters (yellow cells) like WACC, growth %, and tax rates.
- 📊 Professional DCF Valuation: Built-in formulas calculate VSE’s intrinsic value using the Discounted Cash Flow method.
- ⚡ Instant Results: Visualize VSE’s valuation instantly after making changes.
- Scenario Analysis: Test and compare outcomes for various financial assumptions side-by-side.
How It Works
- Step 1: Download the prebuilt Excel template featuring VSE Corporation’s (VSEC) data.
- Step 2: Review the pre-filled sheets to familiarize yourself with the essential metrics.
- Step 3: Modify forecasts and assumptions in the editable yellow cells (WACC, growth, margins).
- Step 4: Instantly see the recalculated results, including VSE Corporation’s (VSEC) intrinsic value.
- Step 5: Utilize the outputs to make informed investment decisions or create reports.
Why Choose This Calculator for VSE Corporation (VSEC)?
- Accuracy: Utilizes real VSE Corporation financials for precise data.
- Flexibility: Allows users to easily test and adjust inputs as needed.
- Time-Saving: Eliminate the need to create a DCF model from the ground up.
- Professional-Grade: Crafted with the expertise and usability expected at the CFO level.
- User-Friendly: Intuitive design makes it accessible for users without extensive financial modeling knowledge.
Who Should Use This Product?
- Finance Students: Master financial analysis techniques and apply them using real-world data.
- Academics: Integrate advanced financial models into your teaching or research projects.
- Investors: Validate your investment strategies and evaluate the valuation metrics for VSE Corporation (VSEC).
- Analysts: Enhance your analysis process with a customizable, ready-to-use DCF model.
- Small Business Owners: Understand the valuation methods used for large public companies like VSE Corporation (VSEC).
What the Template Contains
- Operating and Balance Sheet Data: Pre-filled VSE Corporation (VSEC) historical data and forecasts, including revenue, EBITDA, EBIT, and capital expenditures.
- WACC Calculation: A dedicated sheet for Weighted Average Cost of Capital (WACC), including parameters like Beta, risk-free rate, and share price.
- DCF Valuation (Unlevered and Levered): Editable Discounted Cash Flow models showing intrinsic value with detailed calculations.
- Financial Statements: Pre-loaded financial statements (annual and quarterly) to support analysis.
- Key Ratios: Includes profitability, leverage, and efficiency ratios for VSE Corporation (VSEC).
- Dashboard and Charts: Visual summary of valuation outputs and assumptions to analyze results easily.
Disclaimer
All information, articles, and product details provided on this website are for general informational and educational purposes only. We do not claim any ownership over, nor do we intend to infringe upon, any trademarks, copyrights, logos, brand names, or other intellectual property mentioned or depicted on this site. Such intellectual property remains the property of its respective owners, and any references here are made solely for identification or informational purposes, without implying any affiliation, endorsement, or partnership.
We make no representations or warranties, express or implied, regarding the accuracy, completeness, or suitability of any content or products presented. Nothing on this website should be construed as legal, tax, investment, financial, medical, or other professional advice. In addition, no part of this site—including articles or product references—constitutes a solicitation, recommendation, endorsement, advertisement, or offer to buy or sell any securities, franchises, or other financial instruments, particularly in jurisdictions where such activity would be unlawful.
All content is of a general nature and may not address the specific circumstances of any individual or entity. It is not a substitute for professional advice or services. Any actions you take based on the information provided here are strictly at your own risk. You accept full responsibility for any decisions or outcomes arising from your use of this website and agree to release us from any liability in connection with your use of, or reliance upon, the content or products found herein.