
|
Vishay Intertechnology, Inc. (VSH) DCF Avaliação |
Totalmente Editável: Adapte-Se Às Suas Necessidades No Excel Ou Planilhas
Design Profissional: Modelos Confiáveis E Padrão Da Indústria
Pré-Construídos Para Uso Rápido E Eficiente
Compatível com MAC/PC, totalmente desbloqueado
Não É Necessária Experiência; Fácil De Seguir
Vishay Intertechnology, Inc. (VSH) Bundle
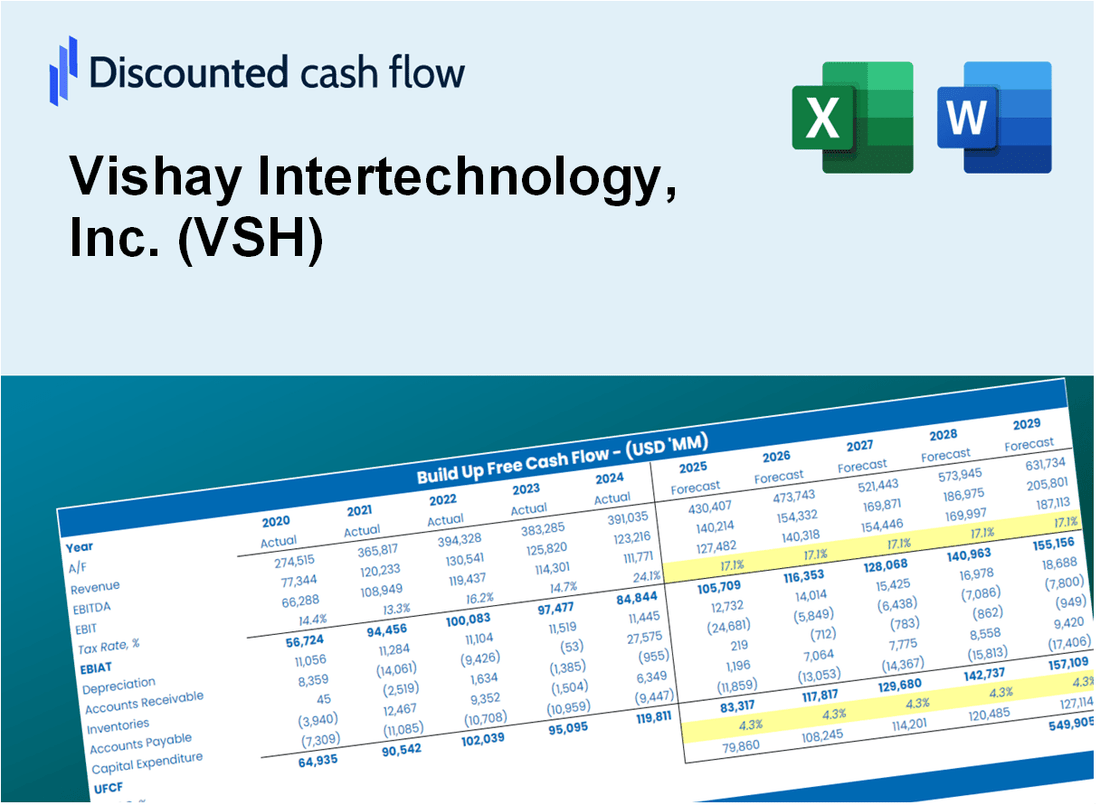
Projetado para precisão, nossa calculadora DCF (VSH) permite avaliar a avaliação Vishay Intertechnology, Inc. usando dados financeiros do mundo real e fornece flexibilidade completa para modificar todos os parâmetros essenciais para projeções aprimoradas.
What You Will Get
- Real Vishay Data: Preloaded financials – from revenue to EBIT – based on actual and projected figures for Vishay Intertechnology, Inc. (VSH).
- Full Customization: Adjust all critical parameters (yellow cells) like WACC, growth %, and tax rates specific to Vishay.
- Instant Valuation Updates: Automatic recalculations to analyze the impact of changes on Vishay’s fair value.
- Versatile Excel Template: Tailored for quick edits, scenario testing, and detailed projections for Vishay Intertechnology, Inc. (VSH).
- Time-Saving and Accurate: Skip building models from scratch while maintaining precision and flexibility for your analysis of Vishay.
Key Features
- Comprehensive DCF Calculator: Offers detailed unlevered and levered DCF valuation models tailored for Vishay Intertechnology, Inc. (VSH).
- WACC Calculator: Features a pre-built Weighted Average Cost of Capital sheet with adjustable inputs specific to Vishay Intertechnology, Inc. (VSH).
- Customizable Forecast Assumptions: Adjust growth rates, capital expenditures, and discount rates to fit Vishay Intertechnology, Inc. (VSH) projections.
- Integrated Financial Ratios: Evaluate profitability, leverage, and efficiency ratios pertinent to Vishay Intertechnology, Inc. (VSH).
- Interactive Dashboard and Charts: Visual representations summarize essential valuation metrics for straightforward analysis of Vishay Intertechnology, Inc. (VSH).
How It Works
- 1. Access the Template: Download and open the Excel file containing Vishay Intertechnology, Inc.'s (VSH) preloaded data.
- 2. Modify Assumptions: Adjust key inputs such as growth rates, WACC, and capital expenditures as needed.
- 3. Instant Results: The DCF model automatically calculates the intrinsic value and NPV based on your inputs.
- 4. Evaluate Scenarios: Analyze various forecasts to explore different valuation possibilities.
- 5. Present with Assurance: Share professional valuation insights to enhance your decision-making process.
Why Choose This Calculator for Vishay Intertechnology, Inc. (VSH)?
- All-in-One Tool: Features DCF, WACC, and financial ratio analyses tailored for Vishay Intertechnology, Inc. (VSH).
- Flexible Inputs: Modify yellow-highlighted cells to explore different financial scenarios.
- In-Depth Analysis: Automatically computes the intrinsic value and Net Present Value for Vishay Intertechnology, Inc. (VSH).
- Preloaded Information: Historical and projected data provide reliable starting points for analysis.
- Expert Level: Perfect for financial analysts, investors, and business consultants focusing on Vishay Intertechnology, Inc. (VSH).
Who Should Use This Product?
- Professional Investors: Develop comprehensive and accurate valuation models for portfolio assessments involving Vishay Intertechnology, Inc. (VSH).
- Corporate Finance Teams: Evaluate valuation scenarios to inform strategic decisions within their organizations.
- Consultants and Advisors: Deliver precise valuation analyses for clients interested in Vishay Intertechnology, Inc. (VSH) stock.
- Students and Educators: Utilize real-time data to enhance learning and practice in financial modeling.
- Tech Enthusiasts: Gain insights into the market valuation of technology companies like Vishay Intertechnology, Inc. (VSH).
What the Template Contains
- Preloaded VSH Data: Historical and projected financial data, including revenue, EBIT, and capital expenditures.
- DCF and WACC Models: Professional-grade sheets for calculating intrinsic value and Weighted Average Cost of Capital.
- Editable Inputs: Yellow-highlighted cells for adjusting revenue growth, tax rates, and discount rates.
- Financial Statements: Comprehensive annual and quarterly financials for deeper analysis.
- Key Ratios: Profitability, leverage, and efficiency ratios to evaluate performance.
- Dashboard and Charts: Visual summaries of valuation outcomes and assumptions.
Disclaimer
All information, articles, and product details provided on this website are for general informational and educational purposes only. We do not claim any ownership over, nor do we intend to infringe upon, any trademarks, copyrights, logos, brand names, or other intellectual property mentioned or depicted on this site. Such intellectual property remains the property of its respective owners, and any references here are made solely for identification or informational purposes, without implying any affiliation, endorsement, or partnership.
We make no representations or warranties, express or implied, regarding the accuracy, completeness, or suitability of any content or products presented. Nothing on this website should be construed as legal, tax, investment, financial, medical, or other professional advice. In addition, no part of this site—including articles or product references—constitutes a solicitation, recommendation, endorsement, advertisement, or offer to buy or sell any securities, franchises, or other financial instruments, particularly in jurisdictions where such activity would be unlawful.
All content is of a general nature and may not address the specific circumstances of any individual or entity. It is not a substitute for professional advice or services. Any actions you take based on the information provided here are strictly at your own risk. You accept full responsibility for any decisions or outcomes arising from your use of this website and agree to release us from any liability in connection with your use of, or reliance upon, the content or products found herein.