
|
Bristow Group Inc. (VTOL) Avaliação DCF |
Totalmente Editável: Adapte-Se Às Suas Necessidades No Excel Ou Planilhas
Design Profissional: Modelos Confiáveis E Padrão Da Indústria
Pré-Construídos Para Uso Rápido E Eficiente
Compatível com MAC/PC, totalmente desbloqueado
Não É Necessária Experiência; Fácil De Seguir
Bristow Group Inc. (VTOL) Bundle
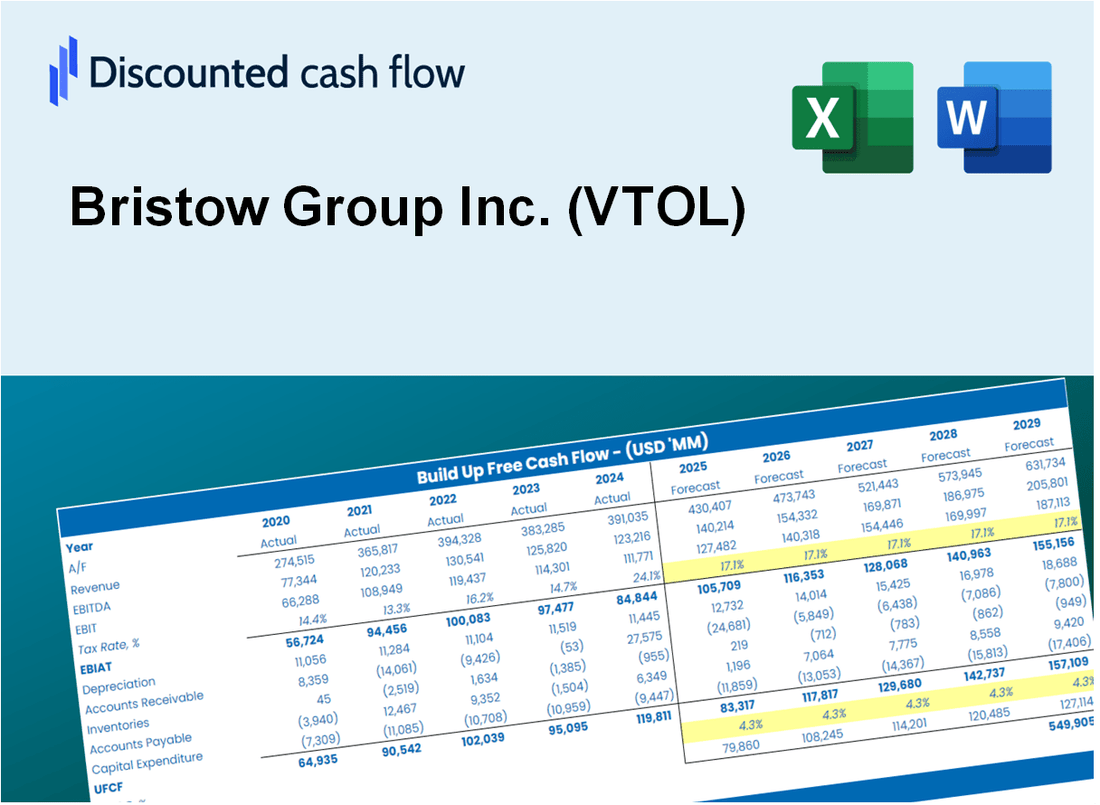
Descubra o valor real do Bristow Group Inc. (VTOL) com nossa calculadora DCF avançada! Ajuste as suposições essenciais, explore vários cenários e avalie como as mudanças afetam a avaliação do Bristow Group Inc. (VTOL) - tudo dentro de um modelo conveniente do Excel.
What You Will Get
- Real VTOL Financial Data: Pre-filled with Bristow Group Inc.'s historical and projected data for precise analysis.
- Fully Editable Template: Modify key inputs like revenue growth, WACC, and EBITDA % with ease.
- Automatic Calculations: See Bristow Group Inc.'s intrinsic value update instantly based on your changes.
- Professional Valuation Tool: Designed for investors, analysts, and consultants seeking accurate DCF results.
- User-Friendly Design: Simple structure and clear instructions for all experience levels.
Key Features
- Accurate Bristow Financials: Gain access to reliable pre-loaded historical data and future forecasts.
- Adjustable Forecast Parameters: Modify highlighted cells for key metrics such as WACC, growth rates, and profit margins.
- Real-Time Calculations: Automatic updates for DCF, Net Present Value (NPV), and cash flow assessments.
- Interactive Dashboard: User-friendly charts and summaries to help visualize your valuation outcomes.
- Suitable for All Levels: A straightforward, intuitive layout designed for investors, CFOs, and consultants alike.
How It Works
- Step 1: Download the Excel file.
- Step 2: Review pre-entered Bristow Group Inc. (VTOL) data (historical and projected).
- Step 3: Adjust key assumptions (yellow cells) based on your analysis.
- Step 4: View automatic recalculations for Bristow Group Inc.'s intrinsic value.
- Step 5: Use the outputs for investment decisions or reporting.
Why Choose Bristow Group Inc. (VTOL)?
- Save Time: Quickly access essential data without the hassle of manual calculations.
- Enhance Precision: Utilize accurate metrics and methodologies to minimize valuation discrepancies.
- Completely Customizable: Adjust the framework to align with your specific forecasts and insights.
- User-Friendly: Intuitive visuals and outputs facilitate straightforward analysis of results.
- Endorsed by Professionals: Crafted for industry experts who prioritize accuracy and efficiency.
Who Should Use This Product?
- Professional Investors: Develop comprehensive and accurate valuation models for analyzing Bristow Group Inc. (VTOL) investments.
- Corporate Finance Teams: Evaluate valuation scenarios to inform strategic decisions within the organization.
- Consultants and Advisors: Offer clients precise valuation insights for Bristow Group Inc. (VTOL) stock.
- Students and Educators: Utilize real-world data to enhance learning and practice in financial modeling.
- Aviation Industry Enthusiasts: Gain insights into how companies like Bristow Group Inc. (VTOL) are valued in the marketplace.
What the Template Contains
- Pre-Filled Data: Includes Bristow Group Inc.’s historical financials and forecasts.
- Discounted Cash Flow Model: Editable DCF valuation model with automatic calculations.
- Weighted Average Cost of Capital (WACC): A dedicated sheet for calculating WACC based on custom inputs.
- Key Financial Ratios: Analyze Bristow Group Inc.’s profitability, efficiency, and leverage.
- Customizable Inputs: Edit revenue growth, margins, and tax rates with ease.
- Clear Dashboard: Charts and tables summarizing key valuation results.
Disclaimer
All information, articles, and product details provided on this website are for general informational and educational purposes only. We do not claim any ownership over, nor do we intend to infringe upon, any trademarks, copyrights, logos, brand names, or other intellectual property mentioned or depicted on this site. Such intellectual property remains the property of its respective owners, and any references here are made solely for identification or informational purposes, without implying any affiliation, endorsement, or partnership.
We make no representations or warranties, express or implied, regarding the accuracy, completeness, or suitability of any content or products presented. Nothing on this website should be construed as legal, tax, investment, financial, medical, or other professional advice. In addition, no part of this site—including articles or product references—constitutes a solicitation, recommendation, endorsement, advertisement, or offer to buy or sell any securities, franchises, or other financial instruments, particularly in jurisdictions where such activity would be unlawful.
All content is of a general nature and may not address the specific circumstances of any individual or entity. It is not a substitute for professional advice or services. Any actions you take based on the information provided here are strictly at your own risk. You accept full responsibility for any decisions or outcomes arising from your use of this website and agree to release us from any liability in connection with your use of, or reliance upon, the content or products found herein.