
|
Avaliação DCF Viatris Inc. (VTRS) |
Totalmente Editável: Adapte-Se Às Suas Necessidades No Excel Ou Planilhas
Design Profissional: Modelos Confiáveis E Padrão Da Indústria
Pré-Construídos Para Uso Rápido E Eficiente
Compatível com MAC/PC, totalmente desbloqueado
Não É Necessária Experiência; Fácil De Seguir
Viatris Inc. (VTRS) Bundle
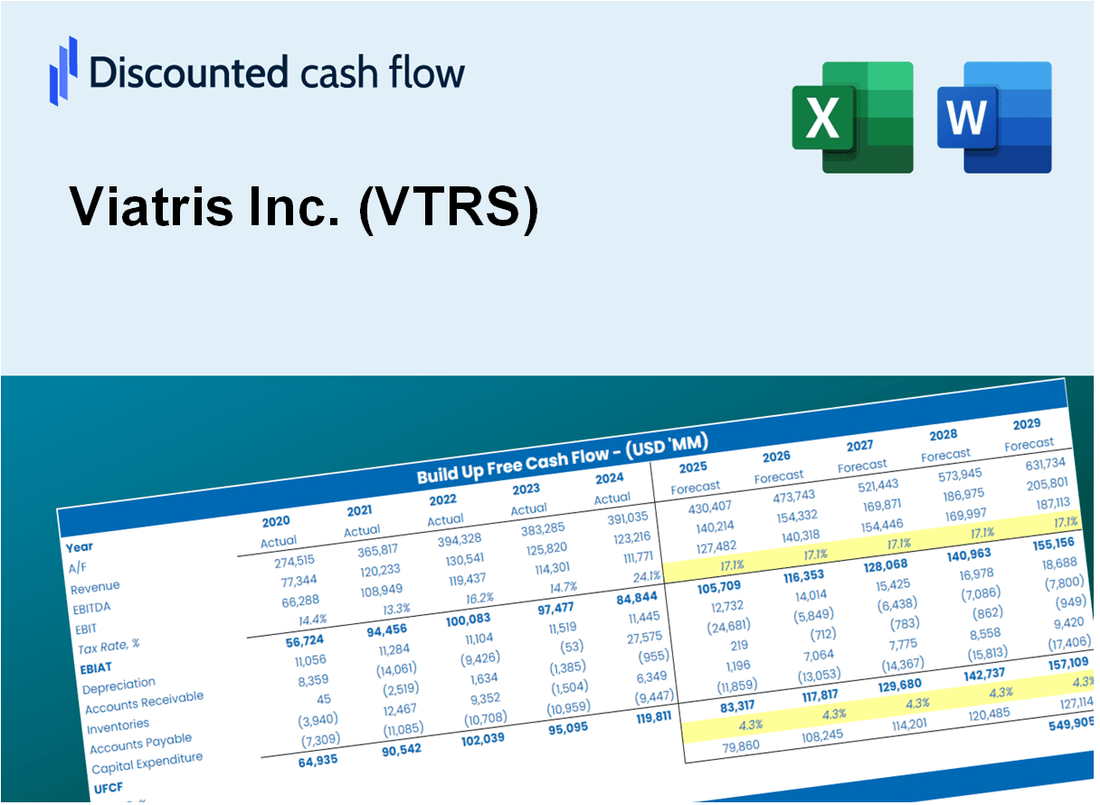
Obtenha um entendimento mais profundo da sua análise de avaliação da Viatris Inc. (VTRS) usando nossa sofisticada calculadora DCF! Este modelo do Excel é pré -carregado com dados reais (VTRs), permitindo que você ajuste as previsões e suposições para calcular com precisão o valor intrínseco da Viatris Inc.
What You Will Get
- Pre-Filled Financial Model: Viatris Inc.'s (VTRS) actual data allows for accurate DCF valuation.
- Full Forecast Control: Modify revenue growth, profit margins, WACC, and other critical parameters.
- Instant Calculations: Automatic updates provide real-time results as you make adjustments.
- Investor-Ready Template: A polished Excel file crafted for high-quality valuation analysis.
- Customizable and Reusable: Designed for adaptability, enabling repeated use for comprehensive forecasts.
Key Features
- Real-Life VTRS Data: Pre-filled with Viatris’ historical financials and forward-looking projections.
- Fully Customizable Inputs: Modify revenue growth, margins, WACC, tax rates, and capital expenditures as needed.
- Dynamic Valuation Model: Automatic updates to Net Present Value (NPV) and intrinsic value based on your adjustments.
- Scenario Testing: Develop multiple forecast scenarios to explore various valuation outcomes.
- User-Friendly Design: Intuitive, organized, and tailored for both professionals and novices.
How It Works
- Step 1: Download the Excel file.
- Step 2: Review pre-entered Viatris Inc. (VTRS) data (historical and projected).
- Step 3: Adjust key assumptions (yellow cells) based on your analysis.
- Step 4: View automatic recalculations for Viatris Inc. (VTRS)’s intrinsic value.
- Step 5: Use the outputs for investment decisions or reporting.
Why Choose This Calculator for Viatris Inc. (VTRS)?
- Accuracy: Utilizes real Viatris financial data for precise calculations.
- Flexibility: Allows users to easily adjust and test various input scenarios.
- Time-Saving: Avoid the complexities of creating a DCF model from the ground up.
- Professional-Grade: Crafted with the precision and usability expected by CFOs.
- User-Friendly: Intuitive interface suitable for users of all financial backgrounds.
Who Should Use This Product?
- Healthcare Professionals: Understand the financial metrics that drive pharmaceutical companies like Viatris Inc. (VTRS).
- Researchers: Utilize real-world data to study the impact of market changes on drug pricing and availability.
- Investors: Evaluate your investment strategies and forecast potential returns for Viatris Inc. (VTRS) stock.
- Financial Analysts: Enhance your analysis with an adaptable DCF model specifically designed for the pharmaceutical sector.
- Entrepreneurs: Learn from the valuation approaches used by large pharmaceutical companies to inform your business strategies.
What the Template Contains
- Operating and Balance Sheet Data: Pre-filled Viatris Inc. (VTRS) historical data and forecasts, including revenue, EBITDA, EBIT, and capital expenditures.
- WACC Calculation: A dedicated sheet for Weighted Average Cost of Capital (WACC), featuring parameters like Beta, risk-free rate, and share price.
- DCF Valuation (Unlevered and Levered): Editable Discounted Cash Flow models illustrating intrinsic value with comprehensive calculations.
- Financial Statements: Pre-loaded financial statements (annual and quarterly) to facilitate analysis.
- Key Ratios: Includes profitability, leverage, and efficiency ratios for Viatris Inc. (VTRS).
- Dashboard and Charts: Visual summary of valuation outputs and assumptions for easy result analysis.
Disclaimer
All information, articles, and product details provided on this website are for general informational and educational purposes only. We do not claim any ownership over, nor do we intend to infringe upon, any trademarks, copyrights, logos, brand names, or other intellectual property mentioned or depicted on this site. Such intellectual property remains the property of its respective owners, and any references here are made solely for identification or informational purposes, without implying any affiliation, endorsement, or partnership.
We make no representations or warranties, express or implied, regarding the accuracy, completeness, or suitability of any content or products presented. Nothing on this website should be construed as legal, tax, investment, financial, medical, or other professional advice. In addition, no part of this site—including articles or product references—constitutes a solicitation, recommendation, endorsement, advertisement, or offer to buy or sell any securities, franchises, or other financial instruments, particularly in jurisdictions where such activity would be unlawful.
All content is of a general nature and may not address the specific circumstances of any individual or entity. It is not a substitute for professional advice or services. Any actions you take based on the information provided here are strictly at your own risk. You accept full responsibility for any decisions or outcomes arising from your use of this website and agree to release us from any liability in connection with your use of, or reliance upon, the content or products found herein.