
|
Avaliação DCF da Vuzix Corporation (Vuzi) |
Totalmente Editável: Adapte-Se Às Suas Necessidades No Excel Ou Planilhas
Design Profissional: Modelos Confiáveis E Padrão Da Indústria
Pré-Construídos Para Uso Rápido E Eficiente
Compatível com MAC/PC, totalmente desbloqueado
Não É Necessária Experiência; Fácil De Seguir
Vuzix Corporation (VUZI) Bundle
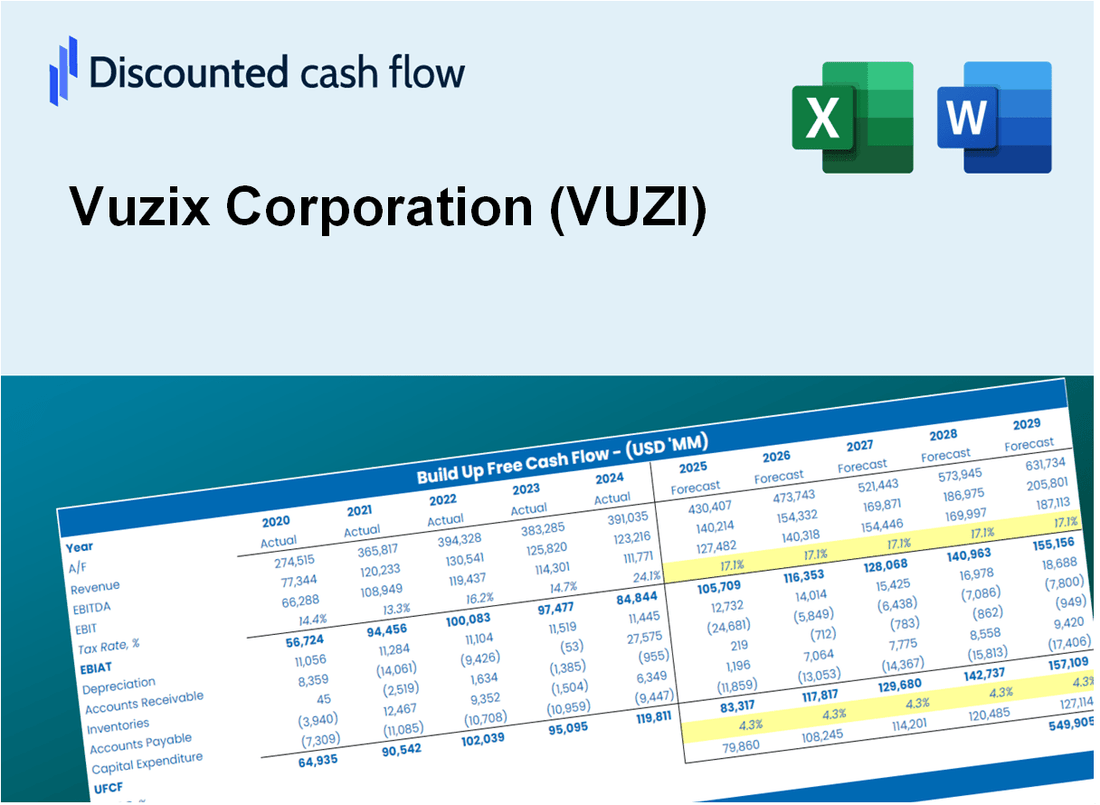
Projetado para precisão, nossa calculadora DCF (Vuzi) permite avaliar a avaliação da Vuzix Corporation usando dados financeiros atualizados e oferece flexibilidade completa para modificar todos os parâmetros essenciais para projeções aprimoradas.
Discounted Cash Flow (DCF) - (USD MM)
| Year | AY1 2020 |
AY2 2021 |
AY3 2022 |
AY4 2023 |
AY5 2024 |
FY1 2025 |
FY2 2026 |
FY3 2027 |
FY4 2028 |
FY5 2029 |
|---|---|---|---|---|---|---|---|---|---|---|
| Revenue | 11.6 | 13.2 | 11.8 | 12.1 | 5.8 | 5.1 | 4.5 | 4.0 | 3.5 | 3.1 |
| Revenue Growth, % | 0 | 13.67 | -10.09 | 2.48 | -52.56 | -11.63 | -11.63 | -11.63 | -11.63 | -11.63 |
| EBITDA | -16.7 | -37.6 | -39.9 | -45.4 | -39.8 | -5.1 | -4.5 | -4.0 | -3.5 | -3.1 |
| EBITDA, % | -144.19 | -285.5 | -337.03 | -374.49 | -691.97 | -100 | -100 | -100 | -100 | -100 |
| Depreciation | 2.5 | 2.8 | 2.6 | 4.9 | 3.8 | 1.7 | 1.5 | 1.4 | 1.2 | 1.1 |
| Depreciation, % | 21.23 | 21.2 | 21.86 | 40.66 | 65.4 | 34.07 | 34.07 | 34.07 | 34.07 | 34.07 |
| EBIT | -19.2 | -40.4 | -42.5 | -50.4 | -43.6 | -5.1 | -4.5 | -4.0 | -3.5 | -3.1 |
| EBIT, % | -165.42 | -306.7 | -358.9 | -415.15 | -757.37 | -100 | -100 | -100 | -100 | -100 |
| Total Cash | 36.1 | 120.2 | 72.6 | 26.6 | 18.2 | 5.1 | 4.5 | 4.0 | 3.5 | 3.1 |
| Total Cash, percent | .0 | .0 | .0 | .0 | .0 | .0 | .0 | .0 | .0 | .0 |
| Account Receivables | 1.4 | 2.2 | 4.3 | 4.2 | 2.3 | 1.4 | 1.3 | 1.1 | 1.0 | .9 |
| Account Receivables, % | 11.99 | 17.03 | 36.29 | 34.64 | 39.68 | 27.93 | 27.93 | 27.93 | 27.93 | 27.93 |
| Inventories | 6.1 | 12.2 | 11.3 | 9.0 | 4.8 | 4.0 | 3.6 | 3.2 | 2.8 | 2.5 |
| Inventories, % | 52.68 | 92.31 | 95.2 | 74.21 | 83.64 | 79.61 | 79.61 | 79.61 | 79.61 | 79.61 |
| Accounts Payable | 1.5 | 2.1 | 1.2 | 1.6 | .5 | .6 | .6 | .5 | .4 | .4 |
| Accounts Payable, % | 13.1 | 15.61 | 10.24 | 12.95 | 9.35 | 12.25 | 12.25 | 12.25 | 12.25 | 12.25 |
| Capital Expenditure | -1.5 | -4.9 | -18.9 | -16.6 | -2.9 | -3.1 | -2.7 | -2.4 | -2.1 | -1.9 |
| Capital Expenditure, % | -12.83 | -36.86 | -159.44 | -136.7 | -50.74 | -60.09 | -60.09 | -60.09 | -60.09 | -60.09 |
| Tax Rate, % | 0 | 0 | 0 | 0 | 0 | 0 | 0 | 0 | 0 | 0 |
| EBITAT | -19.2 | -40.6 | -40.9 | -50.4 | -43.6 | -5.0 | -4.5 | -3.9 | -3.5 | -3.1 |
| Depreciation | ||||||||||
| Changes in Account Receivables | ||||||||||
| Changes in Inventories | ||||||||||
| Changes in Accounts Payable | ||||||||||
| Capital Expenditure | ||||||||||
| UFCF | -24.2 | -49.1 | -59.2 | -59.3 | -37.7 | -4.7 | -5.1 | -4.5 | -4.0 | -3.5 |
| WACC, % | 11.9 | 11.9 | 11.9 | 11.9 | 11.9 | 11.9 | 11.9 | 11.9 | 11.9 | 11.9 |
| PV UFCF | ||||||||||
| SUM PV UFCF | -15.9 | |||||||||
| Long Term Growth Rate, % | 2.00 | |||||||||
| Free cash flow (T + 1) | -4 | |||||||||
| Terminal Value | -36 | |||||||||
| Present Terminal Value | -21 | |||||||||
| Enterprise Value | -36 | |||||||||
| Net Debt | -18 | |||||||||
| Equity Value | -19 | |||||||||
| Diluted Shares Outstanding, MM | 68 | |||||||||
| Equity Value Per Share | -0.28 |
What You Will Get
- Editable Forecast Inputs: Effortlessly modify assumptions (growth %, margins, WACC) to explore various scenarios.
- Real-World Data: Vuzix Corporation’s financial data pre-filled to kickstart your analysis.
- Automatic DCF Outputs: The template computes Net Present Value (NPV) and intrinsic value automatically.
- Customizable and Professional: A sleek Excel model that adjusts to your valuation requirements.
- Built for Analysts and Investors: Perfect for evaluating projections, confirming strategies, and enhancing efficiency.
Key Features
- Comprehensive DCF Calculator: Features detailed unlevered and levered DCF valuation models tailored for Vuzix Corporation (VUZI).
- WACC Estimator: Pre-configured Weighted Average Cost of Capital sheet with adjustable inputs specific to Vuzix Corporation (VUZI).
- Customizable Forecast Parameters: Easily adjust growth rates, capital expenditures, and discount rates for accurate projections.
- Integrated Financial Ratios: Evaluate profitability, leverage, and efficiency ratios relevant to Vuzix Corporation (VUZI).
- Interactive Dashboard and Visualizations: Graphical representations summarize essential valuation metrics for straightforward analysis.
How It Works
- Step 1: Download the Excel file.
- Step 2: Review pre-entered Vuzix Corporation (VUZI) data (historical and projected).
- Step 3: Adjust key assumptions (yellow cells) based on your analysis.
- Step 4: View automatic recalculations for Vuzix Corporation’s intrinsic value.
- Step 5: Use the outputs for investment decisions or reporting.
Why Choose This Calculator?
- User-Friendly Interface: Perfectly crafted for both novices and seasoned professionals.
- Customizable Inputs: Adjust parameters effortlessly to suit your analysis needs.
- Real-Time Adjustments: Observe immediate updates to Vuzix Corporation’s (VUZI) valuation as you modify inputs.
- Preloaded Data: Comes with Vuzix Corporation’s (VUZI) actual financial metrics for swift evaluations.
- Relied Upon by Experts: A go-to tool for investors and analysts aiming for educated decisions.
Who Should Use This Product?
- Professional Investors: Develop comprehensive and accurate valuation models for analyzing Vuzix Corporation (VUZI) investments.
- Corporate Finance Teams: Evaluate valuation scenarios to inform strategic decisions within the organization.
- Consultants and Advisors: Deliver precise valuation insights for clients interested in Vuzix Corporation (VUZI) stock.
- Students and Educators: Utilize real-time data to enhance learning and practice in financial modeling.
- Tech Enthusiasts: Gain insights into how innovative companies like Vuzix Corporation (VUZI) are assessed in the market.
What the Template Contains
- Pre-Filled DCF Model: Vuzix Corporation’s (VUZI) financial data preloaded for immediate use.
- WACC Calculator: Detailed calculations for Weighted Average Cost of Capital.
- Financial Ratios: Evaluate Vuzix Corporation’s (VUZI) profitability, leverage, and efficiency.
- Editable Inputs: Change assumptions such as growth, margins, and CAPEX to fit your scenarios.
- Financial Statements: Annual and quarterly reports to support detailed analysis.
- Interactive Dashboard: Easily visualize key valuation metrics and results.
Disclaimer
All information, articles, and product details provided on this website are for general informational and educational purposes only. We do not claim any ownership over, nor do we intend to infringe upon, any trademarks, copyrights, logos, brand names, or other intellectual property mentioned or depicted on this site. Such intellectual property remains the property of its respective owners, and any references here are made solely for identification or informational purposes, without implying any affiliation, endorsement, or partnership.
We make no representations or warranties, express or implied, regarding the accuracy, completeness, or suitability of any content or products presented. Nothing on this website should be construed as legal, tax, investment, financial, medical, or other professional advice. In addition, no part of this site—including articles or product references—constitutes a solicitation, recommendation, endorsement, advertisement, or offer to buy or sell any securities, franchises, or other financial instruments, particularly in jurisdictions where such activity would be unlawful.
All content is of a general nature and may not address the specific circumstances of any individual or entity. It is not a substitute for professional advice or services. Any actions you take based on the information provided here are strictly at your own risk. You accept full responsibility for any decisions or outcomes arising from your use of this website and agree to release us from any liability in connection with your use of, or reliance upon, the content or products found herein.