
|
Voyager Therapeutics, Inc. (VYGR) Avaliação DCF |
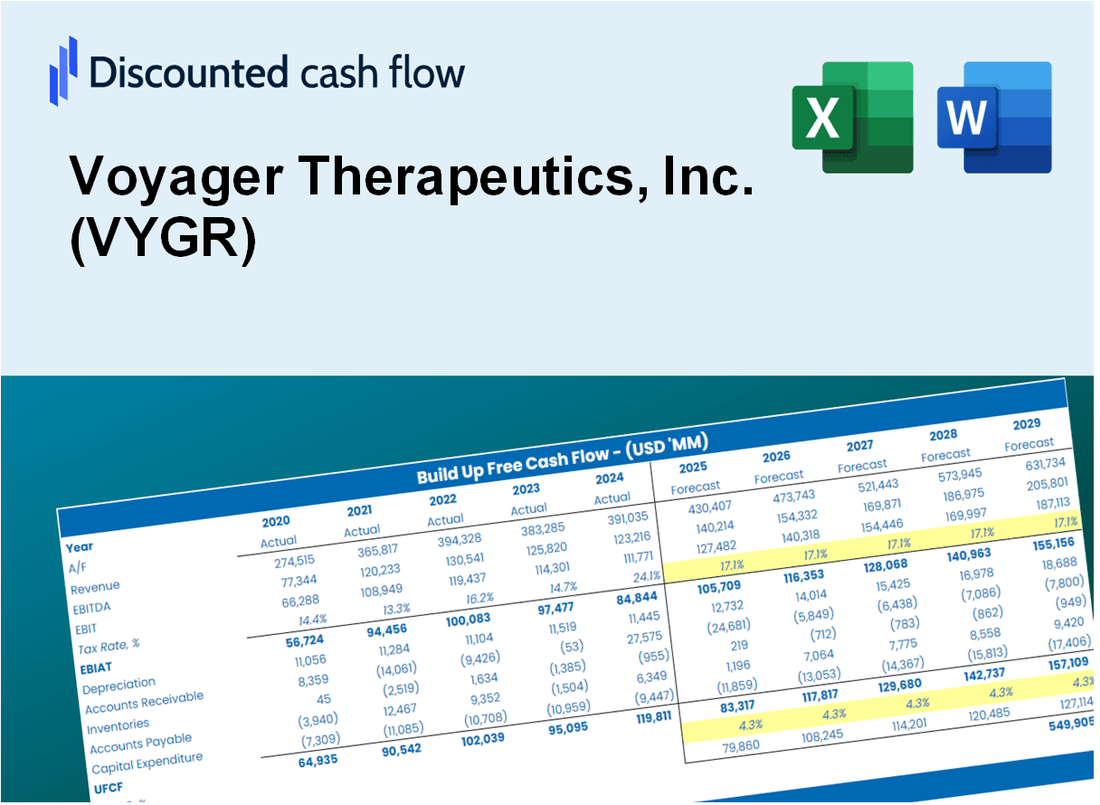
Totalmente Editável: Adapte-Se Às Suas Necessidades No Excel Ou Planilhas
Design Profissional: Modelos Confiáveis E Padrão Da Indústria
Pré-Construídos Para Uso Rápido E Eficiente
Compatível com MAC/PC, totalmente desbloqueado
Não É Necessária Experiência; Fácil De Seguir
Voyager Therapeutics, Inc. (VYGR) Bundle
Procurando determinar o valor intrínseco da Voyager Therapeutics, Inc. (VYGR)? Nossa calculadora DCF (VYGR) integra dados do mundo real com recursos abrangentes de personalização, permitindo ajustar as previsões e aprimorar suas opções de investimento.
What You Will Get
- Real VYGR Financials: Access to historical and projected data for precise valuation.
- Customizable Inputs: Adjust parameters like WACC, tax rates, revenue growth, and capital expenditures.
- Dynamic Calculations: Intrinsic value and NPV are computed in real-time.
- Scenario Analysis: Evaluate various scenarios to assess Voyager’s future performance.
- User-Friendly Design: Designed for professionals while remaining accessible to newcomers.
Key Features
- Comprehensive DCF Calculator: Offers detailed unlevered and levered DCF valuation models tailored for Voyager Therapeutics, Inc. (VYGR).
- WACC Calculator: Pre-built Weighted Average Cost of Capital sheet with adjustable inputs specific to the biotech sector.
- Customizable Forecast Assumptions: Easily adjust growth rates, research and development expenses, and discount rates.
- Integrated Financial Ratios: Evaluate profitability, leverage, and efficiency ratios for Voyager Therapeutics, Inc. (VYGR).
- Interactive Dashboard and Charts: Visual representations summarize key valuation metrics for streamlined analysis.
How It Works
- Download: Obtain the pre-formatted Excel file containing Voyager Therapeutics, Inc.'s (VYGR) financial data.
- Customize: Modify projections such as revenue growth, EBITDA %, and WACC to fit your analysis.
- Update Automatically: Watch as intrinsic value and NPV calculations refresh in real-time.
- Test Scenarios: Develop various projections and instantly compare the results.
- Make Decisions: Leverage the valuation insights to inform your investment choices.
Why Choose This Calculator?
- Designed for Experts: A sophisticated tool utilized by researchers, investment analysts, and biotech professionals.
- Comprehensive Data: Voyager Therapeutics’ historical and projected financials are preloaded for precise analysis.
- Flexible Scenario Analysis: Easily simulate various forecasts and assumptions to assess different outcomes.
- Insightful Outputs: Automatically computes intrinsic value, NPV, and essential metrics for informed decision-making.
- User-Friendly: Step-by-step guidance ensures a smooth experience throughout the calculation process.
Who Should Use This Product?
- Professional Investors: Develop comprehensive and trustworthy valuation models for portfolio assessments of Voyager Therapeutics, Inc. (VYGR).
- Corporate Finance Teams: Evaluate valuation scenarios to inform strategic decisions within their organizations.
- Consultants and Advisors: Deliver precise valuation insights for clients interested in Voyager Therapeutics, Inc. (VYGR).
- Students and Educators: Utilize real-world data to enhance learning and practice in financial modeling.
- Biotech Enthusiasts: Gain insights into how biotech firms like Voyager Therapeutics, Inc. (VYGR) are assessed in the financial landscape.
What the Template Contains
- Pre-Filled DCF Model: Voyager Therapeutics’ financial data preloaded for immediate use.
- WACC Calculator: Detailed calculations for Weighted Average Cost of Capital.
- Financial Ratios: Evaluate Voyager Therapeutics’ profitability, leverage, and efficiency.
- Editable Inputs: Change assumptions such as growth, margins, and CAPEX to fit your scenarios.
- Financial Statements: Annual and quarterly reports to support detailed analysis.
- Interactive Dashboard: Easily visualize key valuation metrics and results.
Disclaimer
All information, articles, and product details provided on this website are for general informational and educational purposes only. We do not claim any ownership over, nor do we intend to infringe upon, any trademarks, copyrights, logos, brand names, or other intellectual property mentioned or depicted on this site. Such intellectual property remains the property of its respective owners, and any references here are made solely for identification or informational purposes, without implying any affiliation, endorsement, or partnership.
We make no representations or warranties, express or implied, regarding the accuracy, completeness, or suitability of any content or products presented. Nothing on this website should be construed as legal, tax, investment, financial, medical, or other professional advice. In addition, no part of this site—including articles or product references—constitutes a solicitation, recommendation, endorsement, advertisement, or offer to buy or sell any securities, franchises, or other financial instruments, particularly in jurisdictions where such activity would be unlawful.
All content is of a general nature and may not address the specific circumstances of any individual or entity. It is not a substitute for professional advice or services. Any actions you take based on the information provided here are strictly at your own risk. You accept full responsibility for any decisions or outcomes arising from your use of this website and agree to release us from any liability in connection with your use of, or reliance upon, the content or products found herein.