
|
Westamerica Bancorporation (WABC) Avaliação DCF |
Totalmente Editável: Adapte-Se Às Suas Necessidades No Excel Ou Planilhas
Design Profissional: Modelos Confiáveis E Padrão Da Indústria
Pré-Construídos Para Uso Rápido E Eficiente
Compatível com MAC/PC, totalmente desbloqueado
Não É Necessária Experiência; Fácil De Seguir
Westamerica Bancorporation (WABC) Bundle
Aprimore suas opções de investimento com a calculadora DCF da WestAmerica Bancorporation (WABC)! Utilize dados financeiros reais, ajuste as projeções e despesas de crescimento e observe como esses ajustes afetam o valor intrínseco da WestAmerica Bancorporation (WABC) em tempo real.
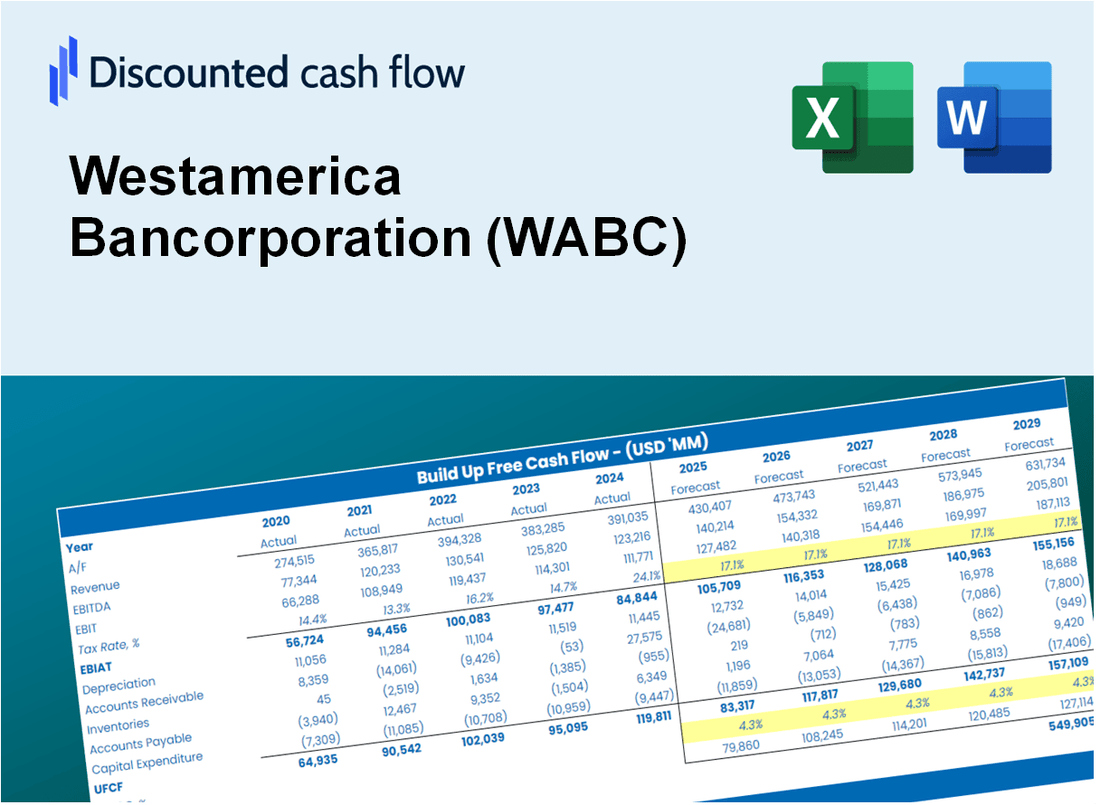
Discounted Cash Flow (DCF) - (USD MM)
| Year | AY1 2020 |
AY2 2021 |
AY3 2022 |
AY4 2023 |
AY5 2024 |
FY1 2025 |
FY2 2026 |
FY3 2027 |
FY4 2028 |
FY5 2029 |
|---|---|---|---|---|---|---|---|---|---|---|
| Revenue | 208.0 | 216.8 | 266.9 | 327.5 | 311.2 | 346.2 | 385.3 | 428.7 | 477.0 | 530.8 |
| Revenue Growth, % | 0 | 4.25 | 23.11 | 22.73 | -5 | 11.27 | 11.27 | 11.27 | 11.27 | 11.27 |
| EBITDA | 129.5 | 133.6 | 182.2 | 233.4 | 199.5 | 226.8 | 252.3 | 280.8 | 312.4 | 347.6 |
| EBITDA, % | 62.25 | 61.65 | 68.25 | 71.25 | 64.1 | 65.5 | 65.5 | 65.5 | 65.5 | 65.5 |
| Depreciation | 22.6 | 16.6 | 16.6 | 11.8 | 10.4 | 22.0 | 24.4 | 27.2 | 30.2 | 33.7 |
| Depreciation, % | 10.89 | 7.67 | 6.21 | 3.59 | 3.34 | 6.34 | 6.34 | 6.34 | 6.34 | 6.34 |
| EBIT | 106.8 | 117.0 | 165.6 | 221.6 | 189.1 | 204.8 | 227.9 | 253.6 | 282.2 | 314.0 |
| EBIT, % | 51.36 | 53.98 | 62.05 | 67.65 | 60.76 | 59.16 | 59.16 | 59.16 | 59.16 | 59.16 |
| Total Cash | 4,684.5 | 5,770.9 | 4,626.0 | 4,190.1 | 1,940.1 | 346.2 | 385.3 | 428.7 | 477.0 | 530.8 |
| Total Cash, percent | .0 | .0 | .0 | .0 | .0 | .0 | .0 | .0 | .0 | .0 |
| Account Receivables | 33.0 | 35.5 | 53.6 | 54.6 | 44.6 | 57.7 | 64.2 | 71.4 | 79.5 | 88.5 |
| Account Receivables, % | 15.88 | 16.39 | 20.07 | 16.66 | 14.33 | 16.67 | 16.67 | 16.67 | 16.67 | 16.67 |
| Inventories | .0 | .0 | .0 | .0 | .0 | .0 | .0 | .0 | .0 | .0 |
| Inventories, % | 0 | 0 | 0 | 0 | 0 | 0 | 0 | 0 | 0 | 0 |
| Accounts Payable | .0 | .0 | .0 | .0 | .0 | .0 | .0 | .0 | .0 | .0 |
| Accounts Payable, % | 0 | 0 | 0 | 0 | 0 | 0 | 0 | 0 | 0 | 0 |
| Capital Expenditure | -2.2 | -1.3 | -.8 | -1.2 | -1.7 | -2.0 | -2.2 | -2.5 | -2.8 | -3.1 |
| Capital Expenditure, % | -1.06 | -0.61073 | -0.30389 | -0.35447 | -0.56047 | -0.57749 | -0.57749 | -0.57749 | -0.57749 | -0.57749 |
| Tax Rate, % | 26.67 | 26.67 | 26.67 | 26.67 | 26.67 | 26.67 | 26.67 | 26.67 | 26.67 | 26.67 |
| EBITAT | 80.4 | 86.5 | 122.0 | 161.8 | 138.6 | 151.3 | 168.3 | 187.3 | 208.4 | 231.9 |
| Depreciation | ||||||||||
| Changes in Account Receivables | ||||||||||
| Changes in Inventories | ||||||||||
| Changes in Accounts Payable | ||||||||||
| Capital Expenditure | ||||||||||
| UFCF | 67.8 | 99.3 | 119.8 | 171.4 | 157.3 | 158.1 | 184.0 | 204.8 | 227.8 | 253.5 |
| WACC, % | 6.87 | 6.86 | 6.85 | 6.84 | 6.85 | 6.86 | 6.86 | 6.86 | 6.86 | 6.86 |
| PV UFCF | ||||||||||
| SUM PV UFCF | 833.7 | |||||||||
| Long Term Growth Rate, % | 2.00 | |||||||||
| Free cash flow (T + 1) | 259 | |||||||||
| Terminal Value | 5,326 | |||||||||
| Present Terminal Value | 3,823 | |||||||||
| Enterprise Value | 4,657 | |||||||||
| Net Debt | -463 | |||||||||
| Equity Value | 5,120 | |||||||||
| Diluted Shares Outstanding, MM | 27 | |||||||||
| Equity Value Per Share | 191.86 |
What You Will Get
- Real WABC Financials: Access to historical and projected data for precise valuation.
- Customizable Inputs: Adjust WACC, tax rates, revenue growth, and capital expenditures as needed.
- Dynamic Calculations: Intrinsic value and NPV are computed automatically.
- Scenario Analysis: Evaluate various scenarios to assess Westamerica Bancorporation’s future performance.
- User-Friendly Design: Designed for professionals while remaining approachable for newcomers.
Key Features
- Comprehensive Financial Data: Westamerica Bancorporation's (WABC) historical financial statements and pre-filled projections.
- Customizable Parameters: Modify WACC, tax rates, revenue growth, and EBITDA margins as needed.
- Real-Time Calculations: Instantly view the intrinsic value of Westamerica Bancorporation (WABC) as it updates.
- Intuitive Visual Representations: Dashboard charts illustrate valuation outcomes and essential metrics.
- Designed for Precision: A reliable tool tailored for analysts, investors, and finance professionals.
How It Works
- Download: Obtain the pre-built Excel file containing Westamerica Bancorporation's (WABC) financial data.
- Customize: Modify forecasts, including revenue growth, EBITDA %, and WACC as per your analysis.
- Update Automatically: The intrinsic value and NPV calculations refresh in real-time.
- Test Scenarios: Develop various projections and instantly compare results.
- Make Decisions: Leverage the valuation outcomes to inform your investment strategy.
Why Choose This Calculator for Westamerica Bancorporation (WABC)?
- User-Friendly Interface: Crafted to accommodate both novices and seasoned users.
- Customizable Inputs: Adjust parameters easily to suit your financial analysis needs.
- Real-Time Valuation: Observe immediate changes to Westamerica's valuation as you alter inputs.
- Preloaded Financials: Comes with Westamerica's actual financial data for swift evaluations.
- Endorsed by Industry Experts: Favored by investors and analysts for making well-informed choices.
Who Should Use This Product?
- Investors: Accurately estimate Westamerica Bancorporation’s (WABC) fair value before making investment decisions.
- CFOs: Utilize a professional-grade DCF model for financial reporting and analysis specific to Westamerica Bancorporation (WABC).
- Consultants: Seamlessly adapt the template for valuation reports tailored to clients interested in Westamerica Bancorporation (WABC).
- Entrepreneurs: Acquire insights into financial modeling practices employed by leading banks like Westamerica Bancorporation (WABC).
- Educators: Implement it as a teaching resource to illustrate valuation methodologies using Westamerica Bancorporation (WABC) as a case study.
What the Template Contains
- Preloaded WABC Data: Historical and projected financial data, including revenue, net interest income, and loan growth.
- DCF and WACC Models: Professional-grade sheets for calculating intrinsic value and Weighted Average Cost of Capital.
- Editable Inputs: Yellow-highlighted cells for adjusting revenue growth, cost of funds, and discount rates.
- Financial Statements: Comprehensive annual and quarterly financials for deeper analysis.
- Key Ratios: Profitability, asset quality, and efficiency ratios to evaluate performance.
- Dashboard and Charts: Visual summaries of valuation outcomes and assumptions.
Disclaimer
All information, articles, and product details provided on this website are for general informational and educational purposes only. We do not claim any ownership over, nor do we intend to infringe upon, any trademarks, copyrights, logos, brand names, or other intellectual property mentioned or depicted on this site. Such intellectual property remains the property of its respective owners, and any references here are made solely for identification or informational purposes, without implying any affiliation, endorsement, or partnership.
We make no representations or warranties, express or implied, regarding the accuracy, completeness, or suitability of any content or products presented. Nothing on this website should be construed as legal, tax, investment, financial, medical, or other professional advice. In addition, no part of this site—including articles or product references—constitutes a solicitation, recommendation, endorsement, advertisement, or offer to buy or sell any securities, franchises, or other financial instruments, particularly in jurisdictions where such activity would be unlawful.
All content is of a general nature and may not address the specific circumstances of any individual or entity. It is not a substitute for professional advice or services. Any actions you take based on the information provided here are strictly at your own risk. You accept full responsibility for any decisions or outcomes arising from your use of this website and agree to release us from any liability in connection with your use of, or reliance upon, the content or products found herein.