
|
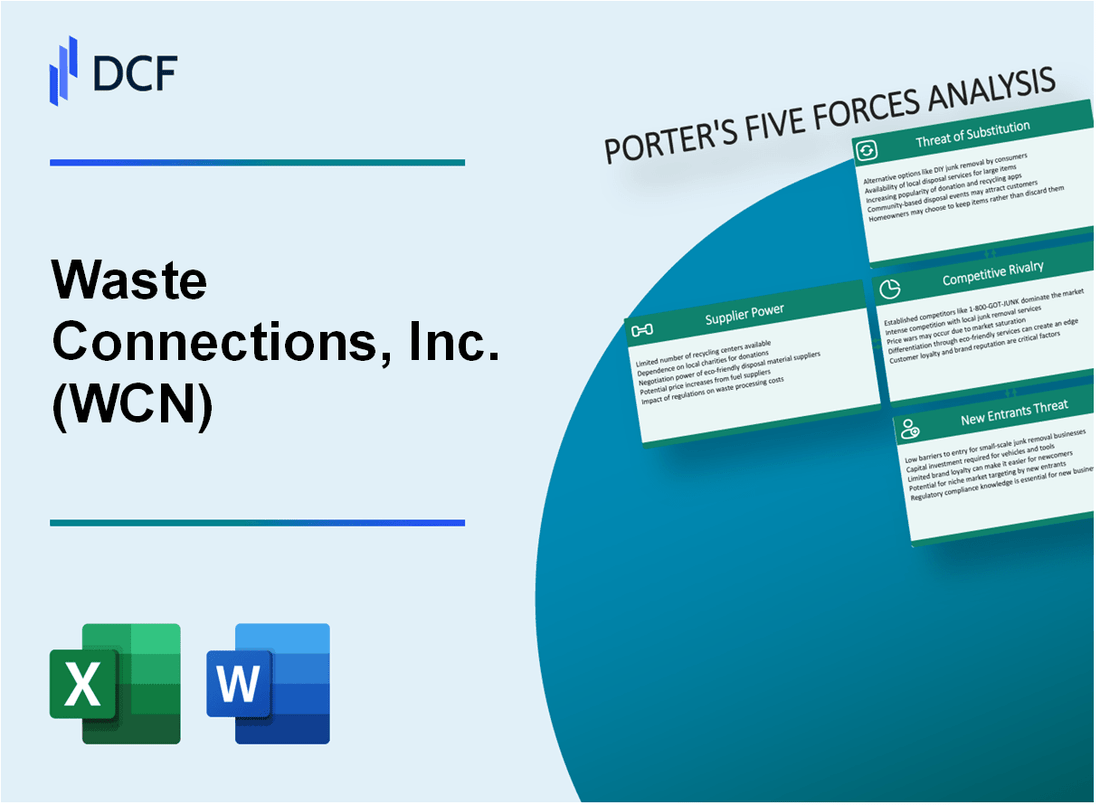
Waste Connections, Inc. (WCN): 5 forças Análise [Jan-2025 Atualizada] |
Totalmente Editável: Adapte-Se Às Suas Necessidades No Excel Ou Planilhas
Design Profissional: Modelos Confiáveis E Padrão Da Indústria
Pré-Construídos Para Uso Rápido E Eficiente
Compatível com MAC/PC, totalmente desbloqueado
Não É Necessária Experiência; Fácil De Seguir
Waste Connections, Inc. (WCN) Bundle
No mundo dinâmico da gestão de resíduos, a Waste Connections, Inc. (WCN) navega em um cenário complexo de forças competitivas que moldam suas decisões estratégicas e posicionamento de mercado. À medida que a sustentabilidade ambiental se torna cada vez mais crítica e a eficiência operacional primordial, compreendendo a intrincada dinâmica de fornecedores, clientes, concorrência do setor, substitutos em potencial e barreiras de entrada de mercado fornecem informações profundas sobre o potencial de resiliência e crescimento da empresa. Este mergulho profundo na estrutura das cinco forças de Michael Porter revela os desafios e oportunidades estratégicas que definem o ecossistema competitivo das conexões de resíduos em 2024.
Waste Connections, Inc. (WCN) - As cinco forças de Porter: poder de barganha dos fornecedores
Número limitado de fabricantes de equipamentos de gerenciamento de resíduos especializados
A partir de 2024, o mercado de fabricação de equipamentos de gerenciamento de resíduos está concentrado com poucos participantes importantes:
| Fabricante | Quota de mercado | Receita anual |
|---|---|---|
| Peterbilt Motors Company | 35.7% | US $ 7,8 bilhões |
| Mack Trucks | 22.4% | US $ 5,3 bilhões |
| Indústrias Autocars | 18.6% | US $ 3,9 bilhões |
Altos custos de comutação para caminhões e contêineres de coleta de resíduos
Custos de substituição de veículos de coleta de resíduos:
- Caminhão de coleta de resíduos padrão: US $ 250.000 - US $ 350.000
- Caminhão de carregador traseiro especializado: US $ 300.000 - $ 450.000
- Caminhão de carregador frontal: US $ 275.000 - $ 400.000
Dependência de fornecedores de combustível para a frota operacional
| Tipo de combustível | Preço médio por galão | Consumo anual |
|---|---|---|
| Diesel | $4.15 | 8,2 milhões de galões |
| Gás natural comprimido | $2.35 | 3,5 milhões de galões equivalentes |
Restrições potenciais da cadeia de suprimentos em tecnologia especializada em gerenciamento de resíduos
Requisitos de investimento em tecnologia:
- Gastos anuais de P&D: US $ 42,6 milhões
- Ciclo de atualização da tecnologia: 3-5 anos
- Principais fornecedores de tecnologia:
- Compologia
- Tecnologias Rubicon
- Resíduo
Waste Connections, Inc. (WCN) - As cinco forças de Porter: poder de barganha dos clientes
Diversificadas Base de Clientes
As conexões de resíduos atendem a 8,8 milhões de clientes residenciais, comerciais e industriais em 47 estados nos Estados Unidos e 6 províncias no Canadá a partir de 2023.
| Segmento de clientes | Porcentagem de receita |
|---|---|
| Serviços residenciais | 42% |
| Serviços comerciais | 38% |
| Serviços industriais | 20% |
Análise de sensibilidade ao preço
O preço médio do serviço de gerenciamento de resíduos para conexões de resíduos em 2023 variou de US $ 18,50 a US $ 22,75 por coleção residencial, com taxas comerciais variando entre US $ 85 e US $ 350 por mês.
Dinâmica do contrato
Taxa de retenção de contratos de longo prazo: 87,6%
- Duração média do contrato: 5-7 anos
- Cláusulas de renovação automática em 63% dos contratos municipais
- Penalidade de rescisão antecipada Camas de penalidade: 15-25% do valor do contrato restante
Demanda de gerenciamento de resíduos sustentável
| Serviço de Sustentabilidade | Taxa de adoção do cliente |
|---|---|
| Programas de reciclagem | 65% |
| Soluções de desperdício em energia | 22% |
| Serviços neutros em carbono | 13% |
Waste Connections, Inc. (WCN) - As cinco forças de Porter: rivalidade competitiva
Cenário consolidado da indústria de gestão de resíduos
Em 2024, o setor de gerenciamento de resíduos demonstra alta concentração com os principais players:
| Empresa | Quota de mercado | Receita anual |
|---|---|---|
| Desperdício de conexões | 10.4% | US $ 8,9 bilhões |
| Waste Management Inc. | 15.2% | US $ 15,6 bilhões |
| Serviços da República | 12.7% | US $ 12,3 bilhões |
Dinâmica de mercado competitiva
A intensidade competitiva no setor de gerenciamento de resíduos revela características significativas de mercado:
- 4 grandes empresas nacionais de gestão de resíduos controlam 68,3% do mercado
- Players regionais ocupam aproximadamente 31,7% de segmento de mercado
- As margens médias de lucro da indústria variam entre 12-15%
Cenário de inovação tecnológica
Investimentos tecnológicos por empresas de gerenciamento de resíduos em 2024:
| Área de tecnologia | Valor do investimento |
|---|---|
| Tecnologias de classificação de resíduos | US $ 287 milhões |
| Automação de reciclagem | US $ 214 milhões |
| Sistemas de rastreamento digital | US $ 156 milhões |
Fusões e estratégia de aquisições
Atividades recentes de consolidação estratégica:
- Valor total de fusões e aquisições no setor de gerenciamento de resíduos: US $ 2,4 bilhões
- Tamanho médio da transação: US $ 187 milhões
- Número de transações concluídas: 13
Waste Connections, Inc. (WCN) - As cinco forças de Porter: ameaça de substitutos
Substitutos diretos limitados para serviços abrangentes de gerenciamento de resíduos
As conexões de resíduos operam em um mercado especializado com substitutos diretos mínimos. A partir de 2024, a empresa gerencia locais de coleta, transferência e descarte de resíduos sólidos em toda a América do Norte.
| Categoria de serviço | Quota de mercado (%) | Dificuldade de substituição |
|---|---|---|
| Coleta municipal de resíduos sólidos | 18.7 | Baixo |
| Gerenciamento de resíduos industriais | 15.3 | Médio |
| Descarte de resíduos especializado | 12.5 | Alto |
Tecnologias emergentes de reciclagem e desperdício em energia
O Waste Connections investiu US $ 87,4 milhões em tecnologias alternativas de processamento de resíduos em 2023.
- Taxa de conversão de desperdício em energia: 22,6%
- Investimento de infraestrutura de reciclagem: US $ 53,2 milhões
- Implementação avançada de tecnologia de classificação: 17 instalações
Foco crescente na economia circular e em estratégias de redução de resíduos
As iniciativas de economia circular da empresa geraram US $ 214,6 milhões em receita em 2023, representando 8,3% da receita total da empresa.
| Métrica da Economia Circular | 2023 valor |
|---|---|
| Volume de recuperação de material | 3,2 milhões de toneladas |
| Taxa de desvio de resíduos | 41.7% |
| Receita de reciclagem | US $ 76,5 milhões |
Concorrência potencial de métodos alternativos de descarte de resíduos
A análise competitiva do cenário revela 3,6% de pressão de mercado de tecnologias alternativas de descarte.
- Conversão de energia de biomassa: 1,2% de participação de mercado
- Tecnologias de reciclagem química: penetração de mercado de 0,8%
- Mineração avançada de aterro: 1,6% segmento de mercado emergente
Waste Connections, Inc. (WCN) - As cinco forças de Porter: ameaça de novos participantes
Altos requisitos de capital para infraestrutura de gerenciamento de resíduos
A Waste Connections, Inc. requer aproximadamente US $ 50-75 milhões em investimento inicial de capital para estabelecer uma operação regional de gerenciamento de resíduos. Os custos de construção do aterro variam entre US $ 15-25 milhões por instalação. Os investimentos em equipamentos incluem:
| Tipo de equipamento | Custo médio |
|---|---|
| Caminhões de coleta de resíduos | US $ 250.000 - US $ 350.000 por caminhão |
| Compactadores | $ 500.000 - US $ 1,2 milhão |
| Máquinas de classificação | US $ 750.000 - US $ 2,5 milhões |
Ambiente regulatório rigoroso e processos de permissão
A conformidade regulatória do gerenciamento de resíduos envolve custos e complexidades substanciais:
- Custos de processo de permissão da EPA: US $ 100.000 - US $ 500.000
- Estudo de impacto ambiental: US $ 75.000 - US $ 250.000
- Monitoramento anual de conformidade: US $ 50.000 - US $ 150.000
Investimento inicial significativo em equipamentos especializados
Faixa total de investimentos em equipamentos especializados: US $ 5 a 10 milhões
| Categoria de equipamento | Intervalo de investimento |
|---|---|
| Veículos de coleta de resíduos | US $ 2-4 milhões |
| Equipamento de processamento de reciclagem | US $ 1,5-3 milhão |
| Tecnologia de classificação de resíduos | US $ 1-2 milhões |
Barreiras locais e estaduais à entrada
As barreiras de entrada de gerenciamento de resíduos incluem:
- Taxas de licença de gerenciamento de resíduos em nível estadual: US $ 50.000 - US $ 250.000
- Requisitos de contrato de gerenciamento municipal de resíduos locais: Mínimo de US $ 5 a 10 milhões de receita anual
- Restrições de zoneamento e custos de conformidade ambiental: US $ 250.000 - US $ 1 milhão
Waste Connections, Inc. (WCN) - Porter's Five Forces: Competitive rivalry
Competitive rivalry within the North American solid waste sector is defined by the dominance of three major, fully integrated players. Waste Connections, Inc. operates as the third-largest entity in this space, positioned behind Waste Management and Republic Services. Collectively, the four top players control $\mathbf{56\%}$ of US landfill industry volumes and $\mathbf{45\%}$ of solid waste collection market share. This concentration at the top suggests intense competition for large-scale contracts and strategic disposal assets.
You can see the relative scale of the top three firms based on recent market capitalization and Waste Connections' 2025 revenue outlook:
| Company | Market Capitalization (Approx.) | 2025 Full-Year Revenue Outlook (USD) | Q2 2025 Revenue |
|---|---|---|---|
| Waste Management | $\mathbf{\$86.9 \text{ billion}}$ | Not explicitly stated for full year 2025 in comparison | N/A |
| Republic Services | $\mathbf{\$67.3 \text{ billion}}$ | Not explicitly stated for full year 2025 in comparison | $\mathbf{\$4.24 \text{ billion}}$ |
| Waste Connections, Inc. | $\mathbf{\$44.7 \text{ billion}}$ | $\mathbf{\$9.45 \text{ billion}}$ to $\mathbf{\$9.6 \text{ billion}}$ | $\mathbf{\$2.41 \text{ billion}}$ (Q2 2025) |
Waste Connections, Inc.'s strategic differentiation centers on its focus in less-contested secondary and rural markets. This approach is designed to reduce the local intensity of competition when compared to the primary, often saturated, urban markets where Waste Management and Republic Services concentrate significant resources. This focus allows Waste Connections, Inc. to achieve higher profit margins relative to its larger rivals.
Vertical integration serves as a critical competitive advantage and a substantial barrier for non-integrated rivals. Waste Connections, Inc. is considered the most vertically integrated among its peers, deriving $\mathbf{79\%}$ of its landfill revenues from internal sources, significantly above the peer group average of $\mathbf{41\%}$. As of late 2025, Waste Connections, Inc. operates $\mathbf{91}$ active landfills, $\mathbf{132}$ transfer stations, and $\mathbf{68}$ recycling operations.
The industry structure remains fragmented enough to support Waste Connections, Inc.'s disciplined growth-by-acquisition strategy. This M&A activity is a constant feature of the competitive environment:
- Waste Connections, Inc. closed $\mathbf{24}$ acquisitions in 2024, adding about $\mathbf{\$750 \text{ million}}$ in annualized revenue.
- Year-to-date through November 2025, the company closed or signed deals totaling roughly $\mathbf{\$300 \text{ million}}$ in annualized revenue.
- Q2 2025 acquisition spend was $\mathbf{\$130.3 \text{M}}$ (net of cash acquired).
- The company expects to close an additional $\mathbf{\$100 \text{ million}}$ to $\mathbf{\$200 \text{ million}}$ in acquisitions by early 2026.
Waste Connections, Inc. (WCN) - Porter's Five Forces: Threat of substitutes
The threat of substitutes for Waste Connections, Inc. remains fundamentally low because no direct, scalable, or cost-equivalent alternative exists for the essential, legally mandated service of collecting and disposing of municipal and commercial solid waste. You cannot simply replace a scheduled garbage truck pickup and permitted landfill disposal with a different service model for the majority of waste streams.
Waste reduction and circular economy initiatives act as partial, long-term substitutes. These efforts aim to reduce the total volume of material requiring final disposal, thereby lowering the demand for traditional collection and landfill services, but they do not eliminate the need for the service itself. Waste Connections, Inc. is actively engaged in these areas, which is a necessary response to market evolution.
- Recycling revenues grew by 9.2% year-over-year for the first six months of 2025.
- Landfill gas (LFG) recovery systems sales represented 1.4% of revenue in 2024.
- The company reported a 54% increase in recycling tons processed from its 2018 baseline as of 2024.
Rising regulatory costs, specifically landfill taxes, are a significant factor pushing customers toward these alternatives. While the national average landfill tipping fee in the U.S. has increased by almost 133% in 35 years, regional spikes are more immediate drivers. For instance, the Northeast U.S. saw landfill fees climb to $84.44 per ton. Furthermore, regulatory bodies globally are implementing sharp tax increases to force diversion. For example, in the UK, the Standard Landfill Tax rate increased to £126.15 per tonne starting April 1, 2025, from £103.70. Such increases create a stronger financial incentive for commercial customers to adopt on-site processing or advanced recycling to avoid escalating disposal costs.
Waste Connections, Inc. mitigates this pressure by aggressively expanding its resource recovery and renewable energy generation services, turning a potential liability into a revenue stream. The company is making substantial capital commitments directly toward these substitute-reducing activities.
| Metric | Value/Amount | Context/Year |
|---|---|---|
| Full-Year 2025 Revenue Outlook | $9.45 billion | 2025 Estimate |
| Capital Expenditures for RNG Facilities | $100 million to $150 million | 2025 Estimate |
| Renewable Energy Output Capacity | Powering approximately 312,000 homes per year | 2025 Data |
| Estimated 2025 Tax Law Benefit | $25 million | 2025 Estimate |
| Q2 2025 Revenue | $2.41 billion | Q2 2025 |
| Lower Landfill Tax Rate (UK Example) | £4.05 per tonne | April 2025 Rate |
The company's strategy focuses on capturing value from materials before they reach the landfill, which directly counters the volume-reducing effect of true substitution. You see this commitment in their planned capital spending; for 2025, capital expenditures are budgeted between $1.200 billion and $1.250 billion, which includes the dedicated funding for RNG facilities. This proactive investment helps secure long-term revenue streams less dependent on traditional disposal tipping fees.
Waste Connections, Inc. (WCN) - Porter's Five Forces: Threat of new entrants
You're looking at the barriers to entry for a new competitor trying to break into Waste Connections, Inc.'s turf. Honestly, the threat here is low, primarily because the industry is built on assets that cost a fortune to acquire and permit. It's not like setting up a software company; you need massive, long-term capital commitments just to get the doors open.
The sheer scale of infrastructure required immediately filters out most potential entrants. Waste Connections, Inc. itself is planning capital expenditures between $1.2 billion and $1.25 billion for the full year 2025. That's the money they are deploying just to maintain and grow their existing footprint, not to build a greenfield operation from scratch. The latest twelve months showed capital expenditures at $1.167 billion. To put the infrastructure cost into perspective, starting a modern landfill can easily require total startup costs ranging from $10 million to over $100 million.
Here's a quick math breakdown of just the initial physical requirements for a new landfill site:
| Cost Component | Estimated Range (USD) | Basis/Notes |
|---|---|---|
| Land Acquisition (200-500 acres) | $2 million to $25 million | Initial land costs |
| Initial Cell Construction (20 acres) | $8 million to $16 million | Includes mandatory composite liner and leachate system |
| Single New Compactor | $800,000 to $1.5 million | Specialized heavy equipment |
| Financial Assurance (Per Acre) | $300,000 to $600,000 | EPA mandate for closure/post-closure care |
Also, that table doesn't even factor in the cost of the specialized fleet needed for collection and hauling, which is another multi-million dollar hurdle. New entrants must also consider that Waste Connections, Inc. is already spending $125 million of its 2025 CapEx just on renewable natural gas (RNG) facilities, showing the ongoing need for massive investment even in ancillary areas.
Regulatory hurdles are arguably an even tougher wall to climb than the capital one. The permitting process for new landfills is a multi-year ordeal involving extensive hydrogeological surveys and environmental impact statements. Waste Connections, Inc. operates under extensive environmental regulations across the U.S. and Canada, governed by federal rules like the EPA's Subtitle D Regulations. States often impose even more stringent requirements, making the path to approval long and uncertain. Regulatory missteps can be financially devastating; for instance, Waste Connections, Inc. recorded about $116 million in impairment expense in 2024 related to the Chiquita Canyon Landfill lawsuit.
The regulatory environment creates specific compliance costs that a new player must immediately absorb:
- Overcoming stringent design and operating standards.
- Securing financial assurance funds upfront.
- Navigating oversight from multiple agencies.
- Managing potential costs from lawsuits or remediation.
The company's strategic positioning in secondary markets further solidifies this barrier. Waste Connections, Inc. serves approximately nine million customers across 46 states and six provinces, focusing heavily on areas where competition is naturally lower. They rely on governmental certificates, exclusive franchise agreements, and exclusive municipal contracts. In places like New York City, contracts are awarded by zone, such as the 20 zones for commercial waste, locking out competition. Even standard long-term collection contracts have a weighted average remaining life of about five years. This density and contract lock-in means a new entrant would struggle to secure the necessary volume to achieve economies of scale quickly. Their dominance in rural markets, for example, is what management believes has historically driven price increases.
Finally, the cost of compliance with these complex environmental and safety regulations is a non-negotiable entry fee. Beyond the initial construction mandates, ongoing operational compliance is costly. The EPA's increased role in coordinating oversight, as seen at the Chiquita Canyon site, is intended to streamline processes, but it underscores the sheer number of agencies a facility must satisfy. Any new entrant must immediately budget for the same high standards of operation, closure planning, and groundwater monitoring that Waste Connections, Inc. already manages, which is baked into the high capital expenditure figures we see.
Finance: draft 13-week cash view by Friday.
Disclaimer
All information, articles, and product details provided on this website are for general informational and educational purposes only. We do not claim any ownership over, nor do we intend to infringe upon, any trademarks, copyrights, logos, brand names, or other intellectual property mentioned or depicted on this site. Such intellectual property remains the property of its respective owners, and any references here are made solely for identification or informational purposes, without implying any affiliation, endorsement, or partnership.
We make no representations or warranties, express or implied, regarding the accuracy, completeness, or suitability of any content or products presented. Nothing on this website should be construed as legal, tax, investment, financial, medical, or other professional advice. In addition, no part of this site—including articles or product references—constitutes a solicitation, recommendation, endorsement, advertisement, or offer to buy or sell any securities, franchises, or other financial instruments, particularly in jurisdictions where such activity would be unlawful.
All content is of a general nature and may not address the specific circumstances of any individual or entity. It is not a substitute for professional advice or services. Any actions you take based on the information provided here are strictly at your own risk. You accept full responsibility for any decisions or outcomes arising from your use of this website and agree to release us from any liability in connection with your use of, or reliance upon, the content or products found herein.