
|
Workday, Inc. (WDAY) DCF Avaliação |
Totalmente Editável: Adapte-Se Às Suas Necessidades No Excel Ou Planilhas
Design Profissional: Modelos Confiáveis E Padrão Da Indústria
Pré-Construídos Para Uso Rápido E Eficiente
Compatível com MAC/PC, totalmente desbloqueado
Não É Necessária Experiência; Fácil De Seguir
Workday, Inc. (WDAY) Bundle
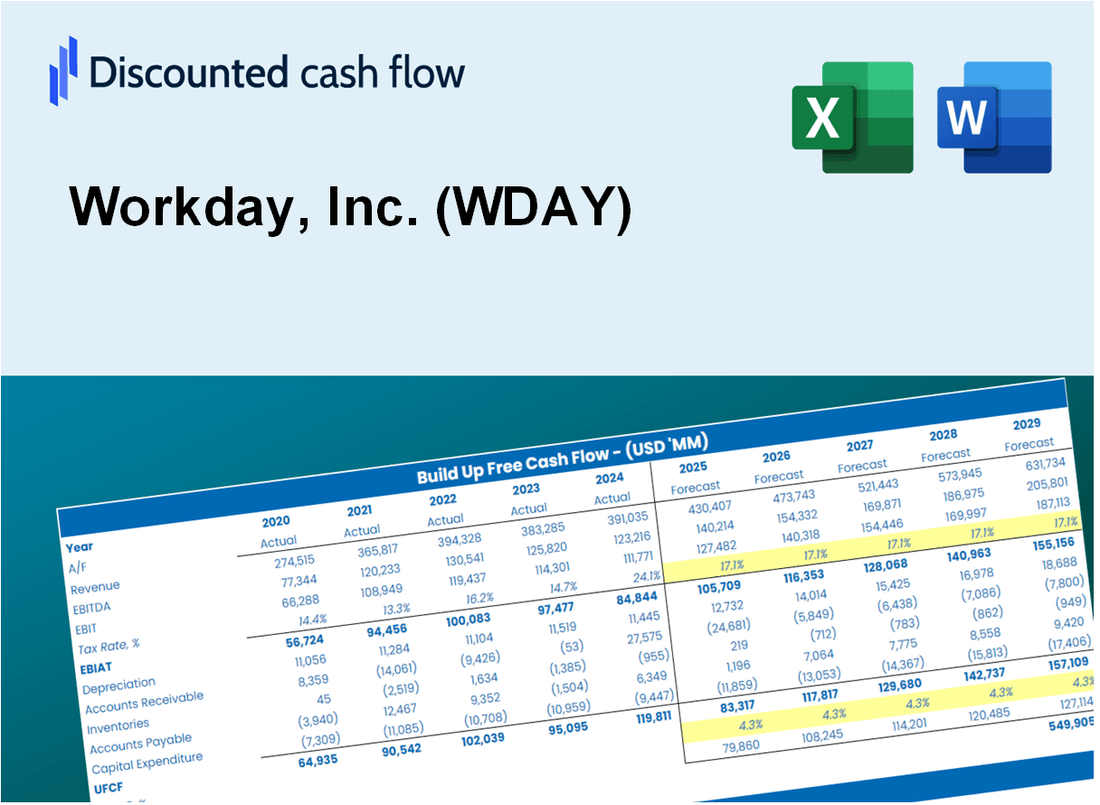
Maximize a eficiência e melhore a precisão com a nossa calculadora DCF (WDAY)! Utilizando dados reais do dia de trabalho e suposições personalizáveis, essa ferramenta capacita você a prever, avaliar e avaliar o Workday, Inc. como um investidor experiente.
What You Will Get
- Real Workday Data: Preloaded financials – from revenue to EBIT – based on actual and projected figures.
- Full Customization: Adjust all critical parameters (yellow cells) like WACC, growth %, and tax rates.
- Instant Valuation Updates: Automatic recalculations to analyze the impact of changes on Workday’s fair value.
- Versatile Excel Template: Tailored for quick edits, scenario testing, and detailed projections.
- Time-Saving and Accurate: Skip building models from scratch while maintaining precision and flexibility.
Key Features
- Comprehensive WDAY Data: Pre-populated with Workday’s historical financial performance and future projections.
- Flexible Input Options: Modify assumptions related to revenue growth, profit margins, WACC, tax rates, and capital investments.
- Interactive Valuation Framework: Instant recalculations of Net Present Value (NPV) and intrinsic value based on your adjustments.
- Scenario Analysis: Develop various forecasting scenarios to evaluate different valuation possibilities.
- Intuitive User Interface: Clean, organized, and tailored for both industry experts and newcomers.
How It Works
- Download the Template: Gain immediate access to the Excel-based WDAY DCF Calculator.
- Input Your Assumptions: Modify the yellow-highlighted cells for growth rates, WACC, margins, and other variables.
- Instant Calculations: The model automatically recalculates Workday’s intrinsic value.
- Test Scenarios: Experiment with different assumptions to assess potential valuation shifts.
- Analyze and Decide: Leverage the results to inform your investment or financial analysis.
Why Choose This Calculator?
- Designed for Experts: A sophisticated tool utilized by finance professionals, analysts, and business consultants.
- Comprehensive Data: Workday’s historical and projected financials integrated for precise analysis.
- Flexible Scenario Analysis: Effortlessly model various forecasts and assumptions.
- Insightful Outputs: Automatically computes intrinsic value, NPV, and other essential metrics.
- User-Friendly: Detailed instructions walk you through each step of the process.
Who Should Use This Product?
- Investors: Evaluate Workday's valuation prior to making stock transactions.
- CFOs and Financial Analysts: Optimize valuation workflows and assess financial forecasts.
- Startup Founders: Understand the valuation methods applied to leading public firms like Workday.
- Consultants: Provide expert valuation analyses and reports for clients.
- Students and Educators: Utilize actual market data to practice and instruct on valuation strategies.
What the Template Contains
- Pre-Filled Data: Includes Workday’s historical financials and forecasts.
- Discounted Cash Flow Model: Editable DCF valuation model with automatic calculations.
- Weighted Average Cost of Capital (WACC): A dedicated sheet for calculating WACC based on custom inputs.
- Key Financial Ratios: Analyze Workday’s profitability, efficiency, and leverage.
- Customizable Inputs: Edit revenue growth, margins, and tax rates with ease.
- Clear Dashboard: Charts and tables summarizing key valuation results.
Disclaimer
All information, articles, and product details provided on this website are for general informational and educational purposes only. We do not claim any ownership over, nor do we intend to infringe upon, any trademarks, copyrights, logos, brand names, or other intellectual property mentioned or depicted on this site. Such intellectual property remains the property of its respective owners, and any references here are made solely for identification or informational purposes, without implying any affiliation, endorsement, or partnership.
We make no representations or warranties, express or implied, regarding the accuracy, completeness, or suitability of any content or products presented. Nothing on this website should be construed as legal, tax, investment, financial, medical, or other professional advice. In addition, no part of this site—including articles or product references—constitutes a solicitation, recommendation, endorsement, advertisement, or offer to buy or sell any securities, franchises, or other financial instruments, particularly in jurisdictions where such activity would be unlawful.
All content is of a general nature and may not address the specific circumstances of any individual or entity. It is not a substitute for professional advice or services. Any actions you take based on the information provided here are strictly at your own risk. You accept full responsibility for any decisions or outcomes arising from your use of this website and agree to release us from any liability in connection with your use of, or reliance upon, the content or products found herein.