
|
Avaliação DCF de Pauw (WDP.BR) |
Totalmente Editável: Adapte-Se Às Suas Necessidades No Excel Ou Planilhas
Design Profissional: Modelos Confiáveis E Padrão Da Indústria
Pré-Construídos Para Uso Rápido E Eficiente
Compatível com MAC/PC, totalmente desbloqueado
Não É Necessária Experiência; Fácil De Seguir
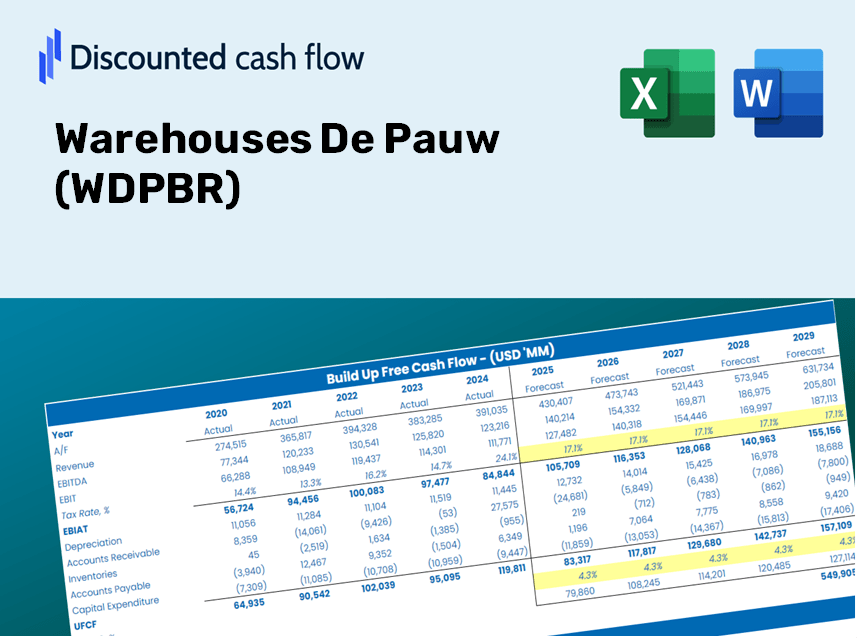
Warehouses De Pauw (WDP.BR) Bundle
Aprimore sua estratégia de investimento com a calculadora WDPBR DCF! Revise os dados financeiros reais dos armazéns de Pauw, ajuste as projeções e despesas de crescimento e observe instantaneamente como essas modificações afetam o valor intrínseco do WDPBR.
Discounted Cash Flow (DCF) - (USD MM)
| Year | AY1 2020 |
AY2 2021 |
AY3 2022 |
AY4 2023 |
AY5 2024 |
FY1 2025 |
FY2 2026 |
FY3 2027 |
FY4 2028 |
FY5 2029 |
|---|---|---|---|---|---|---|---|---|---|---|
| Revenue | 248.9 | 278.7 | 330.7 | 399.8 | 438.4 | 458.7 | 480.0 | 502.3 | 525.6 | 550.0 |
| Revenue Growth, % | 0 | 11.94 | 18.66 | 20.92 | 9.64 | 4.64 | 4.64 | 4.64 | 4.64 | 4.64 |
| EBITDA | 226.1 | 273.0 | 332.1 | 53.0 | 533.2 | 368.8 | 386.0 | 403.9 | 422.6 | 442.2 |
| EBITDA, % | 90.83 | 97.97 | 100.44 | 13.24 | 121.63 | 80.41 | 80.41 | 80.41 | 80.41 | 80.41 |
| Depreciation | 55.1 | 54.8 | 77.5 | 17.4 | 11.9 | 66.4 | 69.4 | 72.7 | 76.0 | 79.6 |
| Depreciation, % | 22.13 | 19.68 | 23.44 | 4.36 | 2.72 | 14.47 | 14.47 | 14.47 | 14.47 | 14.47 |
| EBIT | 171.0 | 218.2 | 254.6 | 35.5 | 521.3 | 305.4 | 319.6 | 334.4 | 349.9 | 366.1 |
| EBIT, % | 68.69 | 78.29 | 77 | 8.88 | 118.91 | 66.57 | 66.57 | 66.57 | 66.57 | 66.57 |
| Total Cash | 11.2 | 9.2 | 8.0 | 13.0 | 10.4 | 14.6 | 15.2 | 16.0 | 16.7 | 17.5 |
| Total Cash, percent | .0 | .0 | .0 | .0 | .0 | .0 | .0 | .0 | .0 | .0 |
| Account Receivables | 12.1 | 19.4 | 23.2 | 23.8 | 41.9 | 31.5 | 33.0 | 34.5 | 36.1 | 37.8 |
| Account Receivables, % | 4.85 | 6.96 | 7.02 | 5.96 | 9.57 | 6.87 | 6.87 | 6.87 | 6.87 | 6.87 |
| Inventories | .0 | .3 | 8.6 | .0 | .0 | 2.5 | 2.6 | 2.7 | 2.8 | 3.0 |
| Inventories, % | 0 | 0.10264 | 2.61 | 0 | 0 | 0.54216 | 0.54216 | 0.54216 | 0.54216 | 0.54216 |
| Accounts Payable | 34.3 | 35.6 | 64.8 | 42.7 | 79.9 | 68.8 | 72.0 | 75.4 | 78.9 | 82.5 |
| Accounts Payable, % | 13.78 | 12.76 | 19.59 | 10.68 | 18.23 | 15.01 | 15.01 | 15.01 | 15.01 | 15.01 |
| Capital Expenditure | -6.3 | -7.6 | -14.0 | -24.4 | -29.3 | -20.5 | -21.4 | -22.4 | -23.4 | -24.5 |
| Capital Expenditure, % | -2.53 | -2.74 | -4.25 | -6.11 | -6.68 | -4.46 | -4.46 | -4.46 | -4.46 | -4.46 |
| Tax Rate, % | 7.91 | 7.91 | 7.91 | 7.91 | 7.91 | 7.91 | 7.91 | 7.91 | 7.91 | 7.91 |
| EBITAT | 165.8 | 192.2 | 261.3 | -22.8 | 480.0 | 230.4 | 241.1 | 252.3 | 264.0 | 276.2 |
| Depreciation | ||||||||||
| Changes in Account Receivables | ||||||||||
| Changes in Inventories | ||||||||||
| Changes in Accounts Payable | ||||||||||
| Capital Expenditure | ||||||||||
| UFCF | 236.9 | 233.1 | 341.9 | -43.9 | 481.8 | 273.1 | 290.7 | 304.2 | 318.3 | 333.1 |
| WACC, % | 6.62 | 6.49 | 6.66 | 5.24 | 6.55 | 6.31 | 6.31 | 6.31 | 6.31 | 6.31 |
| PV UFCF | ||||||||||
| SUM PV UFCF | 1,261.9 | |||||||||
| Long Term Growth Rate, % | 2.00 | |||||||||
| Free cash flow (T + 1) | 340 | |||||||||
| Terminal Value | 7,883 | |||||||||
| Present Terminal Value | 5,805 | |||||||||
| Enterprise Value | 7,067 | |||||||||
| Net Debt | 3,053 | |||||||||
| Equity Value | 4,014 | |||||||||
| Diluted Shares Outstanding, MM | 223 | |||||||||
| Equity Value Per Share | 18.02 |
What You Will Receive
- Genuine WDPBR Financial Data: Access historical and projected figures for precise valuation.
- Customizable Parameters: Adjust WACC, tax rates, revenue growth, and capital expenses.
- Automated Calculations: Intrinsic value and NPV are computed in real-time.
- Scenario Analysis: Explore various scenarios to assess WDPBR's future potential.
- User-Friendly Design: Crafted for experts but easy to navigate for newcomers.
Key Features
- 🔍 Real-Life WDPBR Financials: Pre-filled historical and projected data for Warehouses De Pauw.
- ✏️ Fully Customizable Inputs: Modify all essential parameters (yellow cells) such as WACC, growth %, and tax rates.
- 📊 Professional DCF Valuation: Integrated formulas to determine Warehouses De Pauw's intrinsic value using the Discounted Cash Flow method.
- ⚡ Instant Results: Get immediate visual feedback on Warehouses De Pauw’s valuation after adjustments.
- Scenario Analysis: Evaluate and compare results for different financial assumptions side by side.
How It Works
- Step 1: Download the Excel file.
- Step 2: Examine the pre-filled data for Warehouses De Pauw (WDPBR) including both historical and projected figures.
- Step 3: Modify the key assumptions (highlighted in yellow) based on your own analysis.
- Step 4: Observe the automatic updates reflecting the intrinsic value of Warehouses De Pauw (WDPBR).
- Step 5: Utilize the results for making informed investment choices or for reporting purposes.
Why Choose the WDPBR Calculator?
- User-Friendly Interface: Perfect for both novices and seasoned professionals.
- Customizable Inputs: Easily adjust parameters to suit your detailed analysis.
- Real-Time Valuation: Watch as WDPBR’s valuation updates instantly with your input changes.
- Pre-Loaded Data: Comes with WDPBR’s actual financial information for swift evaluations.
- Preferred by Experts: Trusted by investors and analysts for making strategic decisions.
Who Can Benefit from This Product?
- Real Estate Investors: Develop comprehensive valuation models for assessing warehouse properties.
- Corporate Finance Teams: Evaluate various valuation scenarios to inform strategic decisions.
- Consultants and Advisors: Offer clients precise valuation insights for WDPBR stock.
- Students and Educators: Utilize real-time data for practicing and teaching financial analysis.
- Logistics and Supply Chain Enthusiasts: Gain insights into how companies like Warehouses De Pauw are valued in the market.
Contents of the Template
- Pre-Filled Data: Contains historical financial results and forecasts for Warehouses De Pauw (WDPBR).
- Discounted Cash Flow Model: An editable DCF valuation model with automated calculations.
- Weighted Average Cost of Capital (WACC): A specific sheet for computing WACC based on user-defined inputs.
- Key Financial Ratios: Assess the profitability, efficiency, and leverage of Warehouses De Pauw (WDPBR).
- Customizable Inputs: Effortlessly modify revenue growth, profit margins, and tax rates.
- Clear Dashboard: Visualizations and tables summarizing essential valuation outcomes.
Disclaimer
All information, articles, and product details provided on this website are for general informational and educational purposes only. We do not claim any ownership over, nor do we intend to infringe upon, any trademarks, copyrights, logos, brand names, or other intellectual property mentioned or depicted on this site. Such intellectual property remains the property of its respective owners, and any references here are made solely for identification or informational purposes, without implying any affiliation, endorsement, or partnership.
We make no representations or warranties, express or implied, regarding the accuracy, completeness, or suitability of any content or products presented. Nothing on this website should be construed as legal, tax, investment, financial, medical, or other professional advice. In addition, no part of this site—including articles or product references—constitutes a solicitation, recommendation, endorsement, advertisement, or offer to buy or sell any securities, franchises, or other financial instruments, particularly in jurisdictions where such activity would be unlawful.
All content is of a general nature and may not address the specific circumstances of any individual or entity. It is not a substitute for professional advice or services. Any actions you take based on the information provided here are strictly at your own risk. You accept full responsibility for any decisions or outcomes arising from your use of this website and agree to release us from any liability in connection with your use of, or reliance upon, the content or products found herein.