
|
Wockhardt Limited (Wockpharma.NS) Avaliação DCF |
Totalmente Editável: Adapte-Se Às Suas Necessidades No Excel Ou Planilhas
Design Profissional: Modelos Confiáveis E Padrão Da Indústria
Pré-Construídos Para Uso Rápido E Eficiente
Compatível com MAC/PC, totalmente desbloqueado
Não É Necessária Experiência; Fácil De Seguir
Wockhardt Limited (WOCKPHARMA.NS) Bundle
Aprimore suas opções de investimento com a calculadora DCF Wockhardt Limited (Wockpharmans)! Revise os dados financeiros autênticos de Wockhardt, ajuste as projeções e despesas de crescimento e observe instantaneamente como essas alterações afetam o valor intrínseco da Wockhardt Limited.
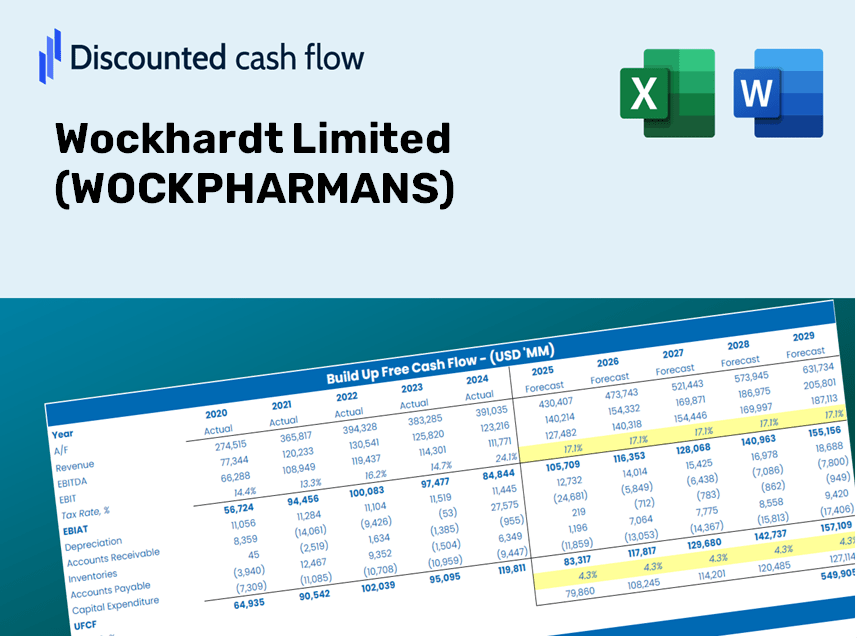
Discounted Cash Flow (DCF) - (USD MM)
| Year | AY1 2021 |
AY2 2022 |
AY3 2023 |
AY4 2024 |
AY5 2025 |
FY1 2026 |
FY2 2027 |
FY3 2028 |
FY4 2029 |
FY5 2030 |
|---|---|---|---|---|---|---|---|---|---|---|
| Revenue | 27,080.0 | 32,300.0 | 26,570.0 | 28,300.0 | 30,350.0 | 31,510.2 | 32,714.8 | 33,965.4 | 35,263.8 | 36,611.9 |
| Revenue Growth, % | 0 | 19.28 | -17.74 | 6.51 | 7.24 | 3.82 | 3.82 | 3.82 | 3.82 | 3.82 |
| EBITDA | -1,430.0 | 2,260.0 | 420.0 | 1,380.0 | 3,600.0 | 1,262.6 | 1,310.9 | 1,361.0 | 1,413.0 | 1,467.0 |
| EBITDA, % | -5.28 | 7 | 1.58 | 4.88 | 11.86 | 4.01 | 4.01 | 4.01 | 4.01 | 4.01 |
| Depreciation | 1,640.0 | 1,750.0 | 1,850.0 | 1,590.0 | 1,570.0 | 1,842.0 | 1,912.4 | 1,985.5 | 2,061.4 | 2,140.2 |
| Depreciation, % | 6.06 | 5.42 | 6.96 | 5.62 | 5.17 | 5.85 | 5.85 | 5.85 | 5.85 | 5.85 |
| EBIT | -3,070.0 | 510.0 | -1,430.0 | -210.0 | 2,030.0 | -579.4 | -601.5 | -624.5 | -648.4 | -673.2 |
| EBIT, % | -11.34 | 1.58 | -5.38 | -0.74205 | 6.69 | -1.84 | -1.84 | -1.84 | -1.84 | -1.84 |
| Total Cash | 2,376.9 | 3,790.0 | 1,500.0 | 5,230.0 | 6,130.0 | 4,085.9 | 4,242.1 | 4,404.3 | 4,572.6 | 4,747.5 |
| Total Cash, percent | .0 | .0 | .0 | .0 | .0 | .0 | .0 | .0 | .0 | .0 |
| Account Receivables | 9,180.0 | 9,680.0 | 7,970.0 | 6,180.0 | 6,610.0 | 8,664.1 | 8,995.4 | 9,339.2 | 9,696.3 | 10,066.9 |
| Account Receivables, % | 33.9 | 29.97 | 30 | 21.84 | 21.78 | 27.5 | 27.5 | 27.5 | 27.5 | 27.5 |
| Inventories | 7,988.8 | 7,690.0 | 6,580.0 | 6,420.0 | 7,250.0 | 7,855.3 | 8,155.6 | 8,467.4 | 8,791.1 | 9,127.1 |
| Inventories, % | 29.5 | 23.81 | 24.76 | 22.69 | 23.89 | 24.93 | 24.93 | 24.93 | 24.93 | 24.93 |
| Accounts Payable | 6,960.0 | 9,210.0 | 8,670.0 | 7,660.0 | 5,920.0 | 8,408.1 | 8,729.6 | 9,063.3 | 9,409.8 | 9,769.5 |
| Accounts Payable, % | 25.7 | 28.51 | 32.63 | 27.07 | 19.51 | 26.68 | 26.68 | 26.68 | 26.68 | 26.68 |
| Capital Expenditure | -1,657.3 | -2,120.0 | -2,090.0 | -2,160.0 | -940.0 | -1,971.2 | -2,046.6 | -2,124.8 | -2,206.0 | -2,290.4 |
| Capital Expenditure, % | -6.12 | -6.56 | -7.87 | -7.63 | -3.1 | -6.26 | -6.26 | -6.26 | -6.26 | -6.26 |
| Tax Rate, % | -193.75 | -193.75 | -193.75 | -193.75 | -193.75 | -193.75 | -193.75 | -193.75 | -193.75 | -193.75 |
| EBITAT | 3,707.8 | 302.8 | -1,281.0 | -231.5 | 5,963.1 | -404.3 | -419.8 | -435.8 | -452.5 | -469.8 |
| Depreciation | ||||||||||
| Changes in Account Receivables | ||||||||||
| Changes in Inventories | ||||||||||
| Changes in Accounts Payable | ||||||||||
| Capital Expenditure | ||||||||||
| UFCF | -6,518.3 | 1,981.6 | 759.0 | 138.5 | 3,593.1 | -704.9 | -864.1 | -897.1 | -931.4 | -967.0 |
| WACC, % | 7.04 | 7.68 | 8.01 | 8.12 | 8.12 | 7.79 | 7.79 | 7.79 | 7.79 | 7.79 |
| PV UFCF | ||||||||||
| SUM PV UFCF | -3,468.3 | |||||||||
| Long Term Growth Rate, % | 2.00 | |||||||||
| Free cash flow (T + 1) | -986 | |||||||||
| Terminal Value | -17,029 | |||||||||
| Present Terminal Value | -11,702 | |||||||||
| Enterprise Value | -15,170 | |||||||||
| Net Debt | 18,300 | |||||||||
| Equity Value | -33,470 | |||||||||
| Diluted Shares Outstanding, MM | 157 | |||||||||
| Equity Value Per Share | -213.31 |
What You'll Receive
- Genuine WOCKPHARMANS Financials: Access to both historical and projected data for precise valuation.
- Customizable Variables: Adjust WACC, tax rates, revenue growth, and capital investments.
- Instant Calculations: Intrinsic value and NPV are computed in real-time.
- Scenario Simulation: Explore various scenarios to assess Wockhardt Limited’s future performance.
- User-Friendly Interface: Designed for professionals, yet easy for newcomers to navigate.
Key Features
- Current WOCKPHARMANS Data: Pre-loaded with Wockhardt Limited's historical financial metrics and projected growth figures.
- Comprehensive Customization Options: Tailor inputs for revenue growth, profit margins, weighted average cost of capital (WACC), tax rates, and capital investments.
- Interactive Valuation Model: Real-time updates to Net Present Value (NPV) and intrinsic value based on your specified inputs.
- Scenario Analysis: Develop various forecasting scenarios to evaluate different valuation results.
- Intuitive User Interface: Designed to be straightforward and accessible for both seasoned professionals and newcomers.
How It Works
- Step 1: Download the Excel file.
- Step 2: Review the pre-filled data for Wockhardt Limited (WOCKPHARMANS), including both historical and projected figures.
- Step 3: Modify key assumptions (highlighted in yellow) according to your findings.
- Step 4: Observe the automatic recalculations for Wockhardt Limited's (WOCKPHARMANS) intrinsic value.
- Step 5: Utilize the results to inform your investment choices or reporting needs.
Why Opt for Wockhardt Limited (WOCKPHARMANS) Solutions?
- Time Efficiency: Skip the hassle of building a financial model from ground zero – our tools are readily accessible.
- Enhanced Accuracy: Dependable financial data and formulas minimize valuation errors.
- Completely Customizable: Adapt the model to align with your specific assumptions and projections.
- User-Friendly: Intuitive charts and outputs simplify the analysis of results.
- Endorsed by Professionals: Crafted for experts who prioritize precision and ease of use.
Who Can Benefit from Wockhardt Limited (WOCKPHARMANS)?
- Investors: Make informed investment choices with a robust valuation tool tailored for pharmaceutical insights.
- Financial Analysts: Streamline your analysis process with an adaptable DCF model specifically designed for the healthcare sector.
- Consultants: Effortlessly modify the template for impactful presentations or detailed reports for clients in the pharmaceutical industry.
- Pharmaceutical Enthusiasts: Enhance your grasp of valuation methods through real-world case studies and examples related to Wockhardt Limited.
- Educators and Students: Utilize this resource as a hands-on learning tool in finance and pharmaceutical courses.
Contents of the Template
- Pre-Filled Data: Contains Wockhardt Limited's historical financial performance and projections.
- Discounted Cash Flow Model: An editable DCF valuation model with automatic calculations included.
- Weighted Average Cost of Capital (WACC): A specialized sheet for calculating WACC with customizable inputs.
- Key Financial Ratios: Assessment of Wockhardt Limited's profitability, efficiency, and leverage metrics.
- Customizable Inputs: Easily modify revenue growth rates, margins, and tax assumptions.
- Clear Dashboard: Visual representations and tables that summarize essential valuation outcomes.
Disclaimer
All information, articles, and product details provided on this website are for general informational and educational purposes only. We do not claim any ownership over, nor do we intend to infringe upon, any trademarks, copyrights, logos, brand names, or other intellectual property mentioned or depicted on this site. Such intellectual property remains the property of its respective owners, and any references here are made solely for identification or informational purposes, without implying any affiliation, endorsement, or partnership.
We make no representations or warranties, express or implied, regarding the accuracy, completeness, or suitability of any content or products presented. Nothing on this website should be construed as legal, tax, investment, financial, medical, or other professional advice. In addition, no part of this site—including articles or product references—constitutes a solicitation, recommendation, endorsement, advertisement, or offer to buy or sell any securities, franchises, or other financial instruments, particularly in jurisdictions where such activity would be unlawful.
All content is of a general nature and may not address the specific circumstances of any individual or entity. It is not a substitute for professional advice or services. Any actions you take based on the information provided here are strictly at your own risk. You accept full responsibility for any decisions or outcomes arising from your use of this website and agree to release us from any liability in connection with your use of, or reliance upon, the content or products found herein.