
|
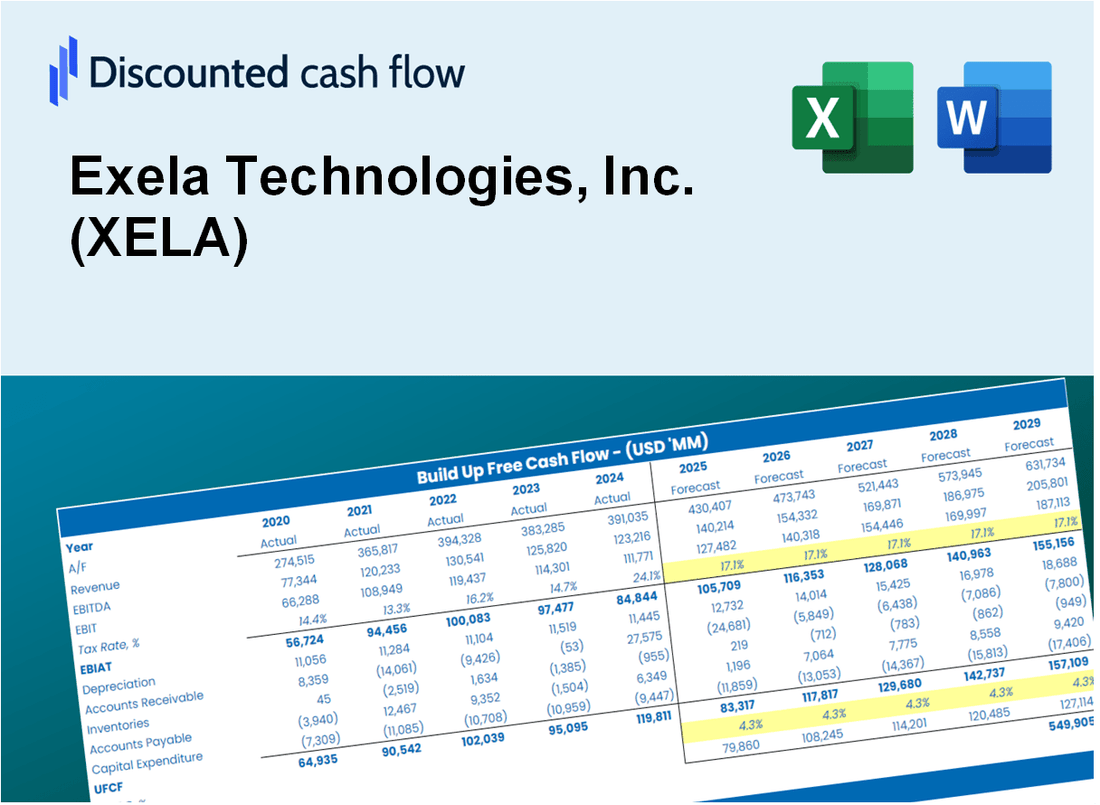
Avaliação DCF da EXELA Technologies, Inc. (Xela) |
Totalmente Editável: Adapte-Se Às Suas Necessidades No Excel Ou Planilhas
Design Profissional: Modelos Confiáveis E Padrão Da Indústria
Pré-Construídos Para Uso Rápido E Eficiente
Compatível com MAC/PC, totalmente desbloqueado
Não É Necessária Experiência; Fácil De Seguir
Exela Technologies, Inc. (XELA) Bundle
Explore o futuro financeiro da EXELA Technologies, Inc. (Xela) com nossa calculadora DCF amigável! Digite suas projeções de crescimento, margens de lucro e despesas para descobrir o valor intrínseco da Exela Technologies, Inc. (Xela) e aprimorar sua abordagem de investimento.
What You Will Get
- Editable Forecast Inputs: Easily modify key assumptions (growth %, margins, WACC) to explore various scenarios.
- Real-World Data: Exela Technologies, Inc. (XELA) financial data pre-loaded to facilitate your analysis.
- Automatic DCF Outputs: The template automatically calculates Net Present Value (NPV) and intrinsic value.
- Customizable and Professional: A sleek Excel model designed to meet your valuation requirements.
- Built for Analysts and Investors: Perfect for evaluating projections, confirming strategies, and enhancing efficiency.
Key Features
- Real-Life XELA Data: Pre-filled with Exela Technologies’ historical financials and forward-looking projections.
- Fully Customizable Inputs: Adjust revenue growth, margins, WACC, tax rates, and capital expenditures.
- Dynamic Valuation Model: Automatic updates to Net Present Value (NPV) and intrinsic value based on your inputs.
- Scenario Testing: Create multiple forecast scenarios to analyze different valuation outcomes.
- User-Friendly Design: Simple, structured, and designed for professionals and beginners alike.
How It Works
- Step 1: Download the Excel file.
- Step 2: Review pre-entered Exela Technologies data (historical and projected).
- Step 3: Adjust key assumptions (yellow cells) based on your analysis.
- Step 4: View automatic recalculations for Exela Technologies’ intrinsic value.
- Step 5: Use the outputs for investment decisions or reporting.
Why Choose This Calculator for Exela Technologies, Inc. (XELA)?
- Designed for Experts: A sophisticated tool tailored for analysts, CFOs, and industry consultants.
- Accurate Data: Exela’s historical and projected financials are preloaded for precise calculations.
- Flexible Scenario Analysis: Effortlessly simulate various forecasts and assumptions.
- Insightful Outputs: Automatically computes intrinsic value, NPV, and essential metrics.
- User-Friendly: Step-by-step guidance ensures a smooth navigation through the process.
Who Should Use This Product?
- Individual Investors: Make informed decisions about buying or selling Exela Technologies stock (XELA).
- Financial Analysts: Streamline valuation processes with ready-to-use financial models specific to Exela Technologies (XELA).
- Consultants: Deliver professional valuation insights related to Exela Technologies (XELA) to clients quickly and accurately.
- Business Owners: Understand how companies like Exela Technologies (XELA) are valued to guide your own business strategy.
- Finance Students: Learn valuation techniques using real-world data and scenarios involving Exela Technologies (XELA).
What the Template Contains
- Pre-Filled Data: Contains Exela Technologies' historical financials and forecasts.
- Discounted Cash Flow Model: Editable DCF valuation model with automated calculations.
- Weighted Average Cost of Capital (WACC): A dedicated sheet for calculating WACC based on personalized inputs.
- Key Financial Ratios: Evaluate Exela Technologies’ profitability, efficiency, and leverage.
- Customizable Inputs: Easily modify revenue growth, margins, and tax rates.
- Clear Dashboard: Visuals and tables summarizing essential valuation outcomes.
Disclaimer
All information, articles, and product details provided on this website are for general informational and educational purposes only. We do not claim any ownership over, nor do we intend to infringe upon, any trademarks, copyrights, logos, brand names, or other intellectual property mentioned or depicted on this site. Such intellectual property remains the property of its respective owners, and any references here are made solely for identification or informational purposes, without implying any affiliation, endorsement, or partnership.
We make no representations or warranties, express or implied, regarding the accuracy, completeness, or suitability of any content or products presented. Nothing on this website should be construed as legal, tax, investment, financial, medical, or other professional advice. In addition, no part of this site—including articles or product references—constitutes a solicitation, recommendation, endorsement, advertisement, or offer to buy or sell any securities, franchises, or other financial instruments, particularly in jurisdictions where such activity would be unlawful.
All content is of a general nature and may not address the specific circumstances of any individual or entity. It is not a substitute for professional advice or services. Any actions you take based on the information provided here are strictly at your own risk. You accept full responsibility for any decisions or outcomes arising from your use of this website and agree to release us from any liability in connection with your use of, or reliance upon, the content or products found herein.