
|
Xeris Biopharma Holdings, Inc. (Xers) Avaliação DCF |
Totalmente Editável: Adapte-Se Às Suas Necessidades No Excel Ou Planilhas
Design Profissional: Modelos Confiáveis E Padrão Da Indústria
Pré-Construídos Para Uso Rápido E Eficiente
Compatível com MAC/PC, totalmente desbloqueado
Não É Necessária Experiência; Fácil De Seguir
Xeris Biopharma Holdings, Inc. (XERS) Bundle
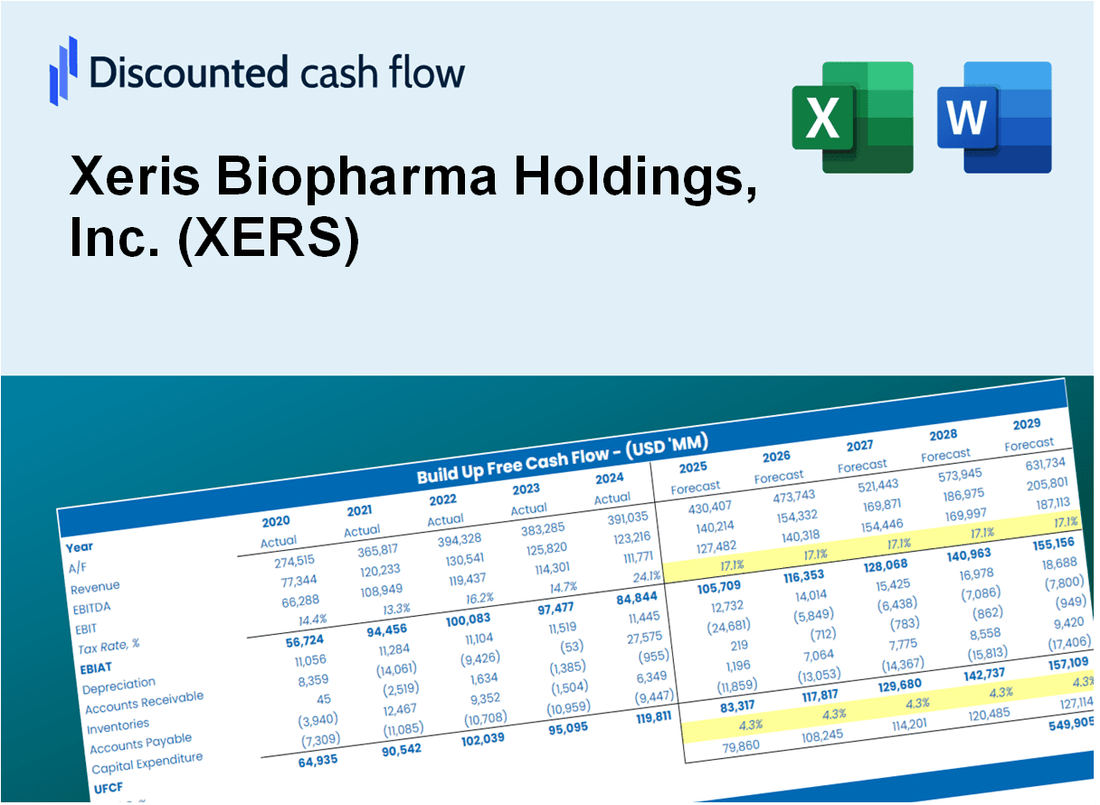
Otimize seu tempo e melhore a precisão com a nossa calculadora DCF (XERS)! Equipado com dados atualizados sobre a Xeris Biopharma Holdings, Inc. e suposições personalizáveis, essa ferramenta permite que você preveja, analise e avalie (Xers), assim como um investidor experiente.
Discounted Cash Flow (DCF) - (USD MM)
| Year | AY1 2020 |
AY2 2021 |
AY3 2022 |
AY4 2023 |
AY5 2024 |
FY1 2025 |
FY2 2026 |
FY3 2027 |
FY4 2028 |
FY5 2029 |
|---|---|---|---|---|---|---|---|---|---|---|
| Revenue | 20.4 | 49.6 | 110.2 | 163.9 | 203.1 | 341.4 | 574.1 | 965.3 | 1,623.1 | 2,729.1 |
| Revenue Growth, % | 0 | 142.67 | 122.32 | 48.68 | 23.89 | 68.14 | 68.14 | 68.14 | 68.14 | 68.14 |
| EBITDA | -79.1 | -113.7 | -69.3 | -23.7 | -14.0 | -194.1 | -326.4 | -548.8 | -922.7 | -1,551.5 |
| EBITDA, % | -387.19 | -229.21 | -62.87 | -14.48 | -6.89 | -56.85 | -56.85 | -56.85 | -56.85 | -56.85 |
| Depreciation | 1.5 | 1.9 | 12.7 | 13.2 | 12.6 | 25.1 | 42.1 | 70.9 | 119.1 | 200.3 |
| Depreciation, % | 7.18 | 3.79 | 11.49 | 8.03 | 6.22 | 7.34 | 7.34 | 7.34 | 7.34 | 7.34 |
| EBIT | -80.6 | -115.5 | -82.0 | -36.9 | -26.6 | -211.7 | -355.9 | -598.5 | -1,006.3 | -1,691.9 |
| EBIT, % | -394.37 | -233 | -74.36 | -22.51 | -13.11 | -62 | -62 | -62 | -62 | -62 |
| Total Cash | 133.8 | 102.4 | 122.0 | 72.5 | 71.6 | 259.1 | 435.7 | 732.6 | 1,231.8 | 2,071.2 |
| Total Cash, percent | .0 | .0 | .0 | .0 | .0 | .0 | .0 | .0 | .0 | .0 |
| Account Receivables | 6.9 | 17.5 | 30.8 | 39.2 | 40.4 | 96.0 | 161.5 | 271.5 | 456.5 | 767.5 |
| Account Receivables, % | 33.64 | 35.2 | 27.96 | 23.91 | 19.9 | 28.12 | 28.12 | 28.12 | 28.12 | 28.12 |
| Inventories | 8.4 | 18.1 | 24.7 | 38.8 | 48.2 | 100.6 | 169.1 | 284.3 | 478.1 | 803.8 |
| Inventories, % | 40.88 | 36.54 | 22.44 | 23.69 | 23.72 | 29.45 | 29.45 | 29.45 | 29.45 | 29.45 |
| Accounts Payable | 3.1 | 8.9 | 4.6 | 11.6 | 2.3 | 31.1 | 52.4 | 88.1 | 148.1 | 248.9 |
| Accounts Payable, % | 15.25 | 18 | 4.18 | 7.06 | 1.13 | 9.12 | 9.12 | 9.12 | 9.12 | 9.12 |
| Capital Expenditure | -1.1 | -.5 | -.5 | -2.3 | -.9 | -5.9 | -9.9 | -16.7 | -28.1 | -47.2 |
| Capital Expenditure, % | -5.31 | -1.06 | -0.47529 | -1.38 | -0.42744 | -1.73 | -1.73 | -1.73 | -1.73 | -1.73 |
| Tax Rate, % | 3.97 | 3.97 | 3.97 | 3.97 | 3.97 | 3.97 | 3.97 | 3.97 | 3.97 | 3.97 |
| EBITAT | -80.5 | -115.5 | -80.8 | -36.2 | -25.6 | -208.5 | -350.6 | -589.4 | -991.1 | -1,666.4 |
| Depreciation | ||||||||||
| Changes in Account Receivables | ||||||||||
| Changes in Inventories | ||||||||||
| Changes in Accounts Payable | ||||||||||
| Capital Expenditure | ||||||||||
| UFCF | -92.2 | -128.7 | -92.9 | -40.8 | -33.6 | -268.5 | -431.1 | -724.8 | -1,218.7 | -2,049.2 |
| WACC, % | 8.93 | 8.94 | 8.9 | 8.89 | 8.84 | 8.9 | 8.9 | 8.9 | 8.9 | 8.9 |
| PV UFCF | ||||||||||
| SUM PV UFCF | -3,375.8 | |||||||||
| Long Term Growth Rate, % | 2.00 | |||||||||
| Free cash flow (T + 1) | -2,090 | |||||||||
| Terminal Value | -30,293 | |||||||||
| Present Terminal Value | -19,779 | |||||||||
| Enterprise Value | -23,155 | |||||||||
| Net Debt | 200 | |||||||||
| Equity Value | -23,354 | |||||||||
| Diluted Shares Outstanding, MM | 147 | |||||||||
| Equity Value Per Share | -159.12 |
What You Will Get
- Editable Excel Template: A fully customizable Excel-based DCF Calculator featuring pre-filled real XERS financials.
- Real-World Data: Access to historical data and forward-looking estimates (highlighted in the yellow cells).
- Forecast Flexibility: Modify forecast assumptions such as revenue growth, EBITDA %, and WACC.
- Automatic Calculations: Quickly observe how your inputs affect Xeris Biopharma's valuation.
- Professional Tool: Designed for investors, CFOs, consultants, and financial analysts.
- User-Friendly Design: Organized for clarity and ease of use, complete with step-by-step instructions.
Key Features
- Comprehensive Financial Data: Gain access to reliable pre-loaded historical performance metrics and future forecasts for Xeris Biopharma Holdings, Inc. (XERS).
- Adjustable Forecast Inputs: Modify highlighted cells for assumptions such as WACC, growth rates, and profit margins.
- Real-Time Calculations: Enjoy automatic recalculations for DCF, Net Present Value (NPV), and cash flow assessments.
- User-Friendly Dashboard: View clear charts and summaries to easily interpret your valuation outcomes.
- Designed for All Skill Levels: An intuitive layout tailored for investors, financial officers, and consultants alike.
How It Works
- Download: Obtain the pre-built Excel file containing Xeris Biopharma Holdings, Inc. (XERS) financial data.
- Customize: Modify projections, such as revenue growth, EBITDA %, and WACC as needed.
- Update Automatically: The intrinsic value and NPV calculations refresh in real-time for accuracy.
- Test Scenarios: Develop various projections and evaluate results instantly.
- Make Decisions: Leverage the valuation outcomes to inform your investment approach.
Why Choose This Calculator for Xeris Biopharma Holdings, Inc. (XERS)?
- User-Friendly Interface: Tailored for both novices and seasoned professionals.
- Customizable Inputs: Easily adjust parameters to suit your financial analysis.
- Real-Time Feedback: Observe immediate changes to Xeris's valuation as you modify inputs.
- Pre-Loaded Data: Comes with Xeris's actual financial metrics for swift evaluations.
- Relied Upon by Experts: Favored by investors and analysts for making well-informed choices.
Who Should Use This Product?
- Professional Investors: Develop comprehensive and accurate valuation models for analyzing portfolios involving Xeris Biopharma Holdings, Inc. (XERS).
- Corporate Finance Teams: Evaluate valuation scenarios to inform strategic decisions within the organization.
- Consultants and Advisors: Deliver precise valuation insights for clients interested in Xeris Biopharma Holdings, Inc. (XERS).
- Students and Educators: Utilize real-time data to enhance learning and practice in financial modeling related to biopharmaceuticals.
- Healthcare Investors: Gain insights into how biopharma companies like Xeris Biopharma Holdings, Inc. (XERS) are assessed in the market.
What the Template Contains
- Preloaded XERS Data: Historical and projected financial data, including revenue, EBIT, and capital expenditures.
- DCF and WACC Models: Professional-grade sheets for calculating intrinsic value and Weighted Average Cost of Capital.
- Editable Inputs: Yellow-highlighted cells for adjusting revenue growth, tax rates, and discount rates.
- Financial Statements: Comprehensive annual and quarterly financials for deeper analysis.
- Key Ratios: Profitability, leverage, and efficiency ratios to evaluate performance.
- Dashboard and Charts: Visual summaries of valuation outcomes and assumptions.
Disclaimer
All information, articles, and product details provided on this website are for general informational and educational purposes only. We do not claim any ownership over, nor do we intend to infringe upon, any trademarks, copyrights, logos, brand names, or other intellectual property mentioned or depicted on this site. Such intellectual property remains the property of its respective owners, and any references here are made solely for identification or informational purposes, without implying any affiliation, endorsement, or partnership.
We make no representations or warranties, express or implied, regarding the accuracy, completeness, or suitability of any content or products presented. Nothing on this website should be construed as legal, tax, investment, financial, medical, or other professional advice. In addition, no part of this site—including articles or product references—constitutes a solicitation, recommendation, endorsement, advertisement, or offer to buy or sell any securities, franchises, or other financial instruments, particularly in jurisdictions where such activity would be unlawful.
All content is of a general nature and may not address the specific circumstances of any individual or entity. It is not a substitute for professional advice or services. Any actions you take based on the information provided here are strictly at your own risk. You accept full responsibility for any decisions or outcomes arising from your use of this website and agree to release us from any liability in connection with your use of, or reliance upon, the content or products found herein.