
|
Avaliação DCF de Habitação de Estudantes Xior (XIOR.BR) |
Totalmente Editável: Adapte-Se Às Suas Necessidades No Excel Ou Planilhas
Design Profissional: Modelos Confiáveis E Padrão Da Indústria
Pré-Construídos Para Uso Rápido E Eficiente
Compatível com MAC/PC, totalmente desbloqueado
Não É Necessária Experiência; Fácil De Seguir
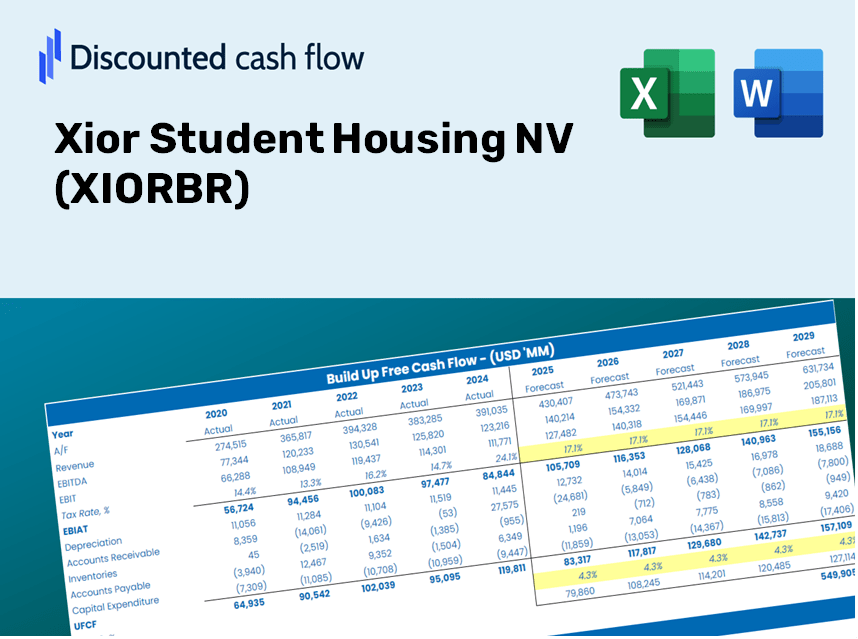
Xior Student Housing NV (XIOR.BR) Bundle
Simplifique a avaliação do XION Student Housing NV com esta calculadora DCF personalizável! Apresentando o REAT XION Student Housing NV Financials e os insumos de previsão ajustável, você pode testar cenários e descobrir o valor justo do Xior Student Housing NV em minutos.
Discounted Cash Flow (DCF) - (USD MM)
| Year | AY1 2020 |
AY2 2021 |
AY3 2022 |
AY4 2023 |
AY5 2024 |
FY1 2025 |
FY2 2026 |
FY3 2027 |
FY4 2028 |
FY5 2029 |
|---|---|---|---|---|---|---|---|---|---|---|
| Revenue | 71.8 | 95.0 | 133.6 | 184.3 | 205.8 | 268.9 | 351.3 | 458.9 | 599.6 | 783.3 |
| Revenue Growth, % | 0 | 32.32 | 40.65 | 37.98 | 11.64 | 30.65 | 30.65 | 30.65 | 30.65 | 30.65 |
| EBITDA | 28.9 | 27.7 | 41.1 | 24.1 | 134.7 | 96.1 | 125.6 | 164.0 | 214.3 | 280.0 |
| EBITDA, % | 40.26 | 29.17 | 30.75 | 13.08 | 65.46 | 35.75 | 35.75 | 35.75 | 35.75 | 35.75 |
| Depreciation | .2 | .2 | .5 | .6 | .4 | .7 | 1.0 | 1.3 | 1.6 | 2.1 |
| Depreciation, % | 0.2661 | 0.21162 | 0.37579 | 0.3152 | 0.19438 | 0.27262 | 0.27262 | 0.27262 | 0.27262 | 0.27262 |
| EBIT | 28.7 | 27.5 | 40.6 | 23.5 | 134.3 | 95.4 | 124.6 | 162.8 | 212.7 | 277.9 |
| EBIT, % | 39.99 | 28.96 | 30.38 | 12.77 | 65.27 | 35.47 | 35.47 | 35.47 | 35.47 | 35.47 |
| Total Cash | 9.9 | 10.8 | 7.8 | 13.8 | 9.5 | 23.2 | 30.3 | 39.6 | 51.7 | 67.6 |
| Total Cash, percent | .0 | .0 | .0 | .0 | .0 | .0 | .0 | .0 | .0 | .0 |
| Account Receivables | 7.9 | 4.2 | 15.1 | 30.7 | 46.1 | 35.4 | 46.2 | 60.4 | 78.9 | 103.0 |
| Account Receivables, % | 11.05 | 4.39 | 11.27 | 16.64 | 22.41 | 13.15 | 13.15 | 13.15 | 13.15 | 13.15 |
| Inventories | 5.6 | 10.5 | 15.1 | .0 | .0 | 16.2 | 21.2 | 27.6 | 36.1 | 47.2 |
| Inventories, % | 7.81 | 11 | 11.3 | 0 | 0 | 6.02 | 6.02 | 6.02 | 6.02 | 6.02 |
| Accounts Payable | 10.6 | 13.5 | 22.3 | 9.6 | 10.6 | 30.1 | 39.3 | 51.4 | 67.2 | 87.7 |
| Accounts Payable, % | 14.76 | 14.21 | 16.69 | 5.22 | 5.13 | 11.2 | 11.2 | 11.2 | 11.2 | 11.2 |
| Capital Expenditure | -.3 | -.4 | -3.7 | -2.3 | -1.9 | -3.1 | -4.0 | -5.3 | -6.9 | -9.0 |
| Capital Expenditure, % | -0.39288 | -0.43483 | -2.75 | -1.24 | -0.93155 | -1.15 | -1.15 | -1.15 | -1.15 | -1.15 |
| Tax Rate, % | 12.9 | 12.9 | 12.9 | 12.9 | 12.9 | 12.9 | 12.9 | 12.9 | 12.9 | 12.9 |
| EBITAT | 31.0 | 23.9 | 37.5 | 14.4 | 117.0 | 81.5 | 106.5 | 139.1 | 181.8 | 237.5 |
| Depreciation | ||||||||||
| Changes in Account Receivables | ||||||||||
| Changes in Inventories | ||||||||||
| Changes in Accounts Payable | ||||||||||
| Capital Expenditure | ||||||||||
| UFCF | 28.0 | 25.5 | 27.6 | -.5 | 101.0 | 93.3 | 96.9 | 126.5 | 165.3 | 216.0 |
| WACC, % | 4.9 | 4.6 | 4.73 | 4.03 | 4.61 | 4.57 | 4.57 | 4.57 | 4.57 | 4.57 |
| PV UFCF | ||||||||||
| SUM PV UFCF | 599.4 | |||||||||
| Long Term Growth Rate, % | 3.00 | |||||||||
| Free cash flow (T + 1) | 222 | |||||||||
| Terminal Value | 14,136 | |||||||||
| Present Terminal Value | 11,303 | |||||||||
| Enterprise Value | 11,902 | |||||||||
| Net Debt | 1,686 | |||||||||
| Equity Value | 10,216 | |||||||||
| Diluted Shares Outstanding, MM | 41 | |||||||||
| Equity Value Per Share | 248.47 |
Benefits of Choosing Xior Student Housing NV (XIORBR)
- Comprehensive Financial Model: Leverage Xior’s real data for accurate DCF valuation.
- Complete Forecast Customization: Modify revenue growth, margins, WACC, and other essential factors.
- Real-Time Calculations: Immediate updates allow you to observe results as adjustments are made.
- Professional-Quality Template: A polished Excel file crafted for high-level valuation analysis.
- Flexible and Repeatable: Designed for adaptability, enabling multiple uses for in-depth forecasts.
Key Features
- Real-Time XIOR Data: Pre-filled with Xior Student Housing's historical metrics and future growth projections.
- Fully Customizable Inputs: Modify rental growth rates, occupancy levels, financing costs, tax implications, and capital investments.
- Dynamic Valuation Model: Automatic adjustments to Net Present Value (NPV) and intrinsic value based on your specified parameters.
- Scenario Analysis: Develop various forecasting scenarios to evaluate different valuation results.
- User-Friendly Interface: Intuitive layout designed for both industry professionals and newcomers.
How It Works
- Download the Template: Gain instant access to the Excel-based Xior Student Housing DCF Calculator.
- Input Your Assumptions: Modify the yellow-highlighted cells for growth rates, WACC, margins, and other parameters.
- Instant Calculations: The model will automatically update the intrinsic value of Xior Student Housing (XIORBR).
- Test Scenarios: Experiment with different assumptions to assess potential changes in valuation.
- Analyze and Decide: Utilize the findings to inform your investment or financial strategy.
Why Opt for This Calculator?
- Designed for Experts: A sophisticated tool favored by analysts, CFOs, and consultants.
- Real-Time Data: Xior Student Housing NV's (XIORBR) historical and projected financials are preloaded for precision.
- Scenario Analysis: Effortlessly simulate various forecasts and assumptions.
- Clear Results: Automatically computes intrinsic value, NPV, and essential metrics.
- User-Friendly: Step-by-step guidance ensures a smooth process.
Who Can Benefit from This Product?
- Investors: Evaluate Xior Student Housing NV's (XIORBR) valuation before making stock transactions.
- CFOs and Financial Analysts: Optimize valuation methodologies and assess financial projections.
- Startup Founders: Gain insights into how established companies like Xior Student Housing NV are valued.
- Consultants: Provide in-depth valuation analysis and reports for clientele.
- Students and Educators: Utilize real data to learn and teach valuation practices effectively.
What the Template Includes
- Preloaded XIORBR Data: Historical and projected financial metrics, encompassing revenue, EBIT, and capital expenditures.
- DCF and WACC Models: Advanced spreadsheets for determining intrinsic value and Weighted Average Cost of Capital.
- Editable Inputs: Cells highlighted in yellow for modifying revenue growth, tax rates, and discount rates.
- Financial Statements: Detailed annual and quarterly financial reports for in-depth analysis.
- Key Ratios: Metrics related to profitability, leverage, and efficiency for performance assessment.
- Dashboard and Charts: Visual representations of valuation results and underlying assumptions.
Disclaimer
All information, articles, and product details provided on this website are for general informational and educational purposes only. We do not claim any ownership over, nor do we intend to infringe upon, any trademarks, copyrights, logos, brand names, or other intellectual property mentioned or depicted on this site. Such intellectual property remains the property of its respective owners, and any references here are made solely for identification or informational purposes, without implying any affiliation, endorsement, or partnership.
We make no representations or warranties, express or implied, regarding the accuracy, completeness, or suitability of any content or products presented. Nothing on this website should be construed as legal, tax, investment, financial, medical, or other professional advice. In addition, no part of this site—including articles or product references—constitutes a solicitation, recommendation, endorsement, advertisement, or offer to buy or sell any securities, franchises, or other financial instruments, particularly in jurisdictions where such activity would be unlawful.
All content is of a general nature and may not address the specific circumstances of any individual or entity. It is not a substitute for professional advice or services. Any actions you take based on the information provided here are strictly at your own risk. You accept full responsibility for any decisions or outcomes arising from your use of this website and agree to release us from any liability in connection with your use of, or reliance upon, the content or products found herein.