
|
Avaliação DCF da Zebra Technologies Corporation (ZBRA) |
Totalmente Editável: Adapte-Se Às Suas Necessidades No Excel Ou Planilhas
Design Profissional: Modelos Confiáveis E Padrão Da Indústria
Pré-Construídos Para Uso Rápido E Eficiente
Compatível com MAC/PC, totalmente desbloqueado
Não É Necessária Experiência; Fácil De Seguir
Zebra Technologies Corporation (ZBRA) Bundle
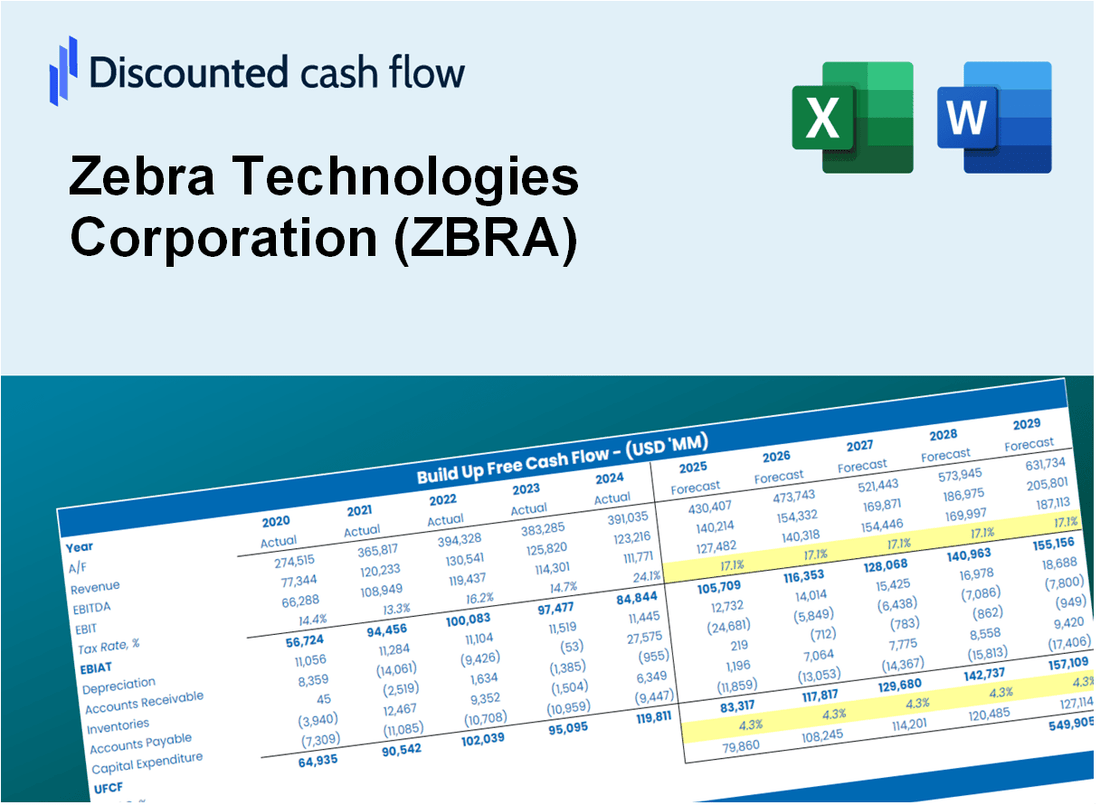
Obtenha informações sobre a análise de avaliação da Zebra Technologies Corporation (ZBRA) com nossa calculadora DCF de última geração! Este modelo do Excel é pré -carregado com dados reais (ZBRA), permitindo que você ajuste as previsões e suposições para calcular com precisão o valor intrínseco da Zebra Technologies Corporation.
Discounted Cash Flow (DCF) - (USD MM)
| Year | AY1 2020 |
AY2 2021 |
AY3 2022 |
AY4 2023 |
AY5 2024 |
FY1 2025 |
FY2 2026 |
FY3 2027 |
FY4 2028 |
FY5 2029 |
|---|---|---|---|---|---|---|---|---|---|---|
| Revenue | 4,448.0 | 5,627.0 | 5,781.0 | 4,584.0 | 4,981.0 | 5,195.2 | 5,418.5 | 5,651.5 | 5,894.5 | 6,147.9 |
| Revenue Growth, % | 0 | 26.51 | 2.74 | -20.71 | 8.66 | 4.3 | 4.3 | 4.3 | 4.3 | 4.3 |
| EBITDA | 782.0 | 1,160.0 | 1,140.0 | 761.0 | 937.0 | 969.7 | 1,011.4 | 1,054.9 | 1,100.2 | 1,147.5 |
| EBITDA, % | 17.58 | 20.61 | 19.72 | 16.6 | 18.81 | 18.67 | 18.67 | 18.67 | 18.67 | 18.67 |
| Depreciation | 146.0 | 187.0 | 204.0 | 176.0 | 172.0 | 181.1 | 188.9 | 197.0 | 205.4 | 214.3 |
| Depreciation, % | 3.28 | 3.32 | 3.53 | 3.84 | 3.45 | 3.49 | 3.49 | 3.49 | 3.49 | 3.49 |
| EBIT | 636.0 | 973.0 | 936.0 | 585.0 | 765.0 | 788.6 | 822.5 | 857.9 | 894.8 | 933.3 |
| EBIT, % | 14.3 | 17.29 | 16.19 | 12.76 | 15.36 | 15.18 | 15.18 | 15.18 | 15.18 | 15.18 |
| Total Cash | 168.0 | 332.0 | 105.0 | 137.0 | 901.0 | 338.4 | 353.0 | 368.1 | 384.0 | 400.5 |
| Total Cash, percent | .0 | .0 | .0 | .0 | .0 | .0 | .0 | .0 | .0 | .0 |
| Account Receivables | 524.0 | 760.0 | 794.0 | 584.0 | 712.0 | 686.3 | 715.8 | 746.6 | 778.7 | 812.2 |
| Account Receivables, % | 11.78 | 13.51 | 13.73 | 12.74 | 14.29 | 13.21 | 13.21 | 13.21 | 13.21 | 13.21 |
| Inventories | 511.0 | 491.0 | 860.0 | 804.0 | 693.0 | 691.4 | 721.1 | 752.1 | 784.5 | 818.2 |
| Inventories, % | 11.49 | 8.73 | 14.88 | 17.54 | 13.91 | 13.31 | 13.31 | 13.31 | 13.31 | 13.31 |
| Accounts Payable | 601.0 | 700.0 | 811.0 | 456.0 | 633.0 | 650.8 | 678.8 | 708.0 | 738.4 | 770.2 |
| Accounts Payable, % | 13.51 | 12.44 | 14.03 | 9.95 | 12.71 | 12.53 | 12.53 | 12.53 | 12.53 | 12.53 |
| Capital Expenditure | -67.0 | -59.0 | -75.0 | -87.0 | -59.0 | -72.1 | -75.2 | -78.4 | -81.8 | -85.3 |
| Capital Expenditure, % | -1.51 | -1.05 | -1.3 | -1.9 | -1.18 | -1.39 | -1.39 | -1.39 | -1.39 | -1.39 |
| Tax Rate, % | 16.85 | 16.85 | 16.85 | 16.85 | 16.85 | 16.85 | 16.85 | 16.85 | 16.85 | 16.85 |
| EBITAT | 572.4 | 841.3 | 796.6 | 518.4 | 636.1 | 683.5 | 712.9 | 743.6 | 775.5 | 808.9 |
| Depreciation | ||||||||||
| Changes in Account Receivables | ||||||||||
| Changes in Inventories | ||||||||||
| Changes in Accounts Payable | ||||||||||
| Capital Expenditure | ||||||||||
| UFCF | 217.4 | 852.3 | 633.6 | 518.4 | 909.1 | 837.6 | 795.4 | 829.5 | 865.2 | 902.4 |
| WACC, % | 10.56 | 10.53 | 10.52 | 10.55 | 10.5 | 10.53 | 10.53 | 10.53 | 10.53 | 10.53 |
| PV UFCF | ||||||||||
| SUM PV UFCF | 3,149.9 | |||||||||
| Long Term Growth Rate, % | 4.00 | |||||||||
| Free cash flow (T + 1) | 939 | |||||||||
| Terminal Value | 14,372 | |||||||||
| Present Terminal Value | 8,712 | |||||||||
| Enterprise Value | 11,862 | |||||||||
| Net Debt | 1,461 | |||||||||
| Equity Value | 10,401 | |||||||||
| Diluted Shares Outstanding, MM | 52 | |||||||||
| Equity Value Per Share | 200.48 |
What You Will Receive
- Pre-Filled Financial Model: Zebra Technologies’ actual data facilitates accurate DCF valuation.
- Full Forecast Control: Modify revenue growth, margins, WACC, and other essential drivers.
- Instant Calculations: Automatic updates allow you to view results in real-time as you make adjustments.
- Investor-Ready Template: A polished Excel file crafted for professional-level valuation.
- Customizable and Reusable: Designed for adaptability, enabling repeated use for comprehensive forecasts.
Key Features
- Customizable Financial Metrics: Adjust essential parameters such as revenue projections, profit margins, and investment outlays.
- Instant DCF Valuation: Quickly computes intrinsic value, net present value (NPV), and additional financial metrics.
- High-Precision Accuracy: Leverages Zebra Technologies' actual financial data for credible valuation results.
- Effortless Scenario Analysis: Evaluate various scenarios and easily compare results.
- Efficiency Booster: Streamline the valuation process without the hassle of constructing intricate models from the ground up.
How It Works
- Download the Template: Gain immediate access to the Excel-based ZBRA DCF Calculator.
- Input Your Assumptions: Modify the yellow-highlighted cells for growth rates, WACC, margins, and other key metrics.
- Instant Calculations: The model will automatically recalculate Zebra Technologies' intrinsic value.
- Test Scenarios: Experiment with different assumptions to assess potential changes in valuation.
- Analyze and Decide: Utilize the results to inform your investment or financial analysis decisions.
Why Choose This Calculator for Zebra Technologies Corporation (ZBRA)?
- Designed for Industry Experts: A sophisticated tool utilized by analysts, CFOs, and industry consultants.
- Comprehensive Data: Zebra's historical and estimated financials are preloaded for precise analysis.
- Flexible Scenario Analysis: Effortlessly simulate various forecasts and assumptions.
- Insightful Outputs: Automatically computes intrinsic value, NPV, and essential metrics.
- User-Friendly: Step-by-step guidance ensures a smooth experience throughout the process.
Who Should Use This Product?
- Professional Investors: Develop comprehensive and accurate valuation models for portfolio management related to Zebra Technologies (ZBRA).
- Corporate Finance Teams: Evaluate valuation scenarios to inform strategic decisions within their organizations.
- Consultants and Advisors: Deliver precise valuation insights for clients interested in Zebra Technologies (ZBRA) stock.
- Students and Educators: Utilize real-world data to enhance learning and practice in financial modeling.
- Tech Enthusiasts: Gain insights into how technology companies like Zebra Technologies (ZBRA) are appraised in the financial market.
What the Template Contains
- Comprehensive DCF Model: Editable template with detailed valuation calculations tailored for Zebra Technologies Corporation (ZBRA).
- Real-World Data: Zebra's historical and projected financials preloaded for in-depth analysis.
- Customizable Parameters: Adjust WACC, growth rates, and tax assumptions to explore various scenarios.
- Financial Statements: Complete annual and quarterly breakdowns for enhanced insights.
- Key Ratios: Integrated analysis for profitability, efficiency, and leverage metrics.
- Dashboard with Visual Outputs: Charts and tables designed for clear, actionable results.
Disclaimer
All information, articles, and product details provided on this website are for general informational and educational purposes only. We do not claim any ownership over, nor do we intend to infringe upon, any trademarks, copyrights, logos, brand names, or other intellectual property mentioned or depicted on this site. Such intellectual property remains the property of its respective owners, and any references here are made solely for identification or informational purposes, without implying any affiliation, endorsement, or partnership.
We make no representations or warranties, express or implied, regarding the accuracy, completeness, or suitability of any content or products presented. Nothing on this website should be construed as legal, tax, investment, financial, medical, or other professional advice. In addition, no part of this site—including articles or product references—constitutes a solicitation, recommendation, endorsement, advertisement, or offer to buy or sell any securities, franchises, or other financial instruments, particularly in jurisdictions where such activity would be unlawful.
All content is of a general nature and may not address the specific circumstances of any individual or entity. It is not a substitute for professional advice or services. Any actions you take based on the information provided here are strictly at your own risk. You accept full responsibility for any decisions or outcomes arising from your use of this website and agree to release us from any liability in connection with your use of, or reliance upon, the content or products found herein.