
|
Avaliação DCF Zedge, Inc. (ZDGE) |
Totalmente Editável: Adapte-Se Às Suas Necessidades No Excel Ou Planilhas
Design Profissional: Modelos Confiáveis E Padrão Da Indústria
Pré-Construídos Para Uso Rápido E Eficiente
Compatível com MAC/PC, totalmente desbloqueado
Não É Necessária Experiência; Fácil De Seguir
Zedge, Inc. (ZDGE) Bundle
Aprimore suas opções de investimento com a calculadora DCF Zedge, Inc. (ZDGE)! Revise os dados financeiros precisos, ajuste as previsões e despesas do crescimento e observe como essas modificações afetam o valor intrínseco da Zedge, Inc. (ZDGE) em tempo real.
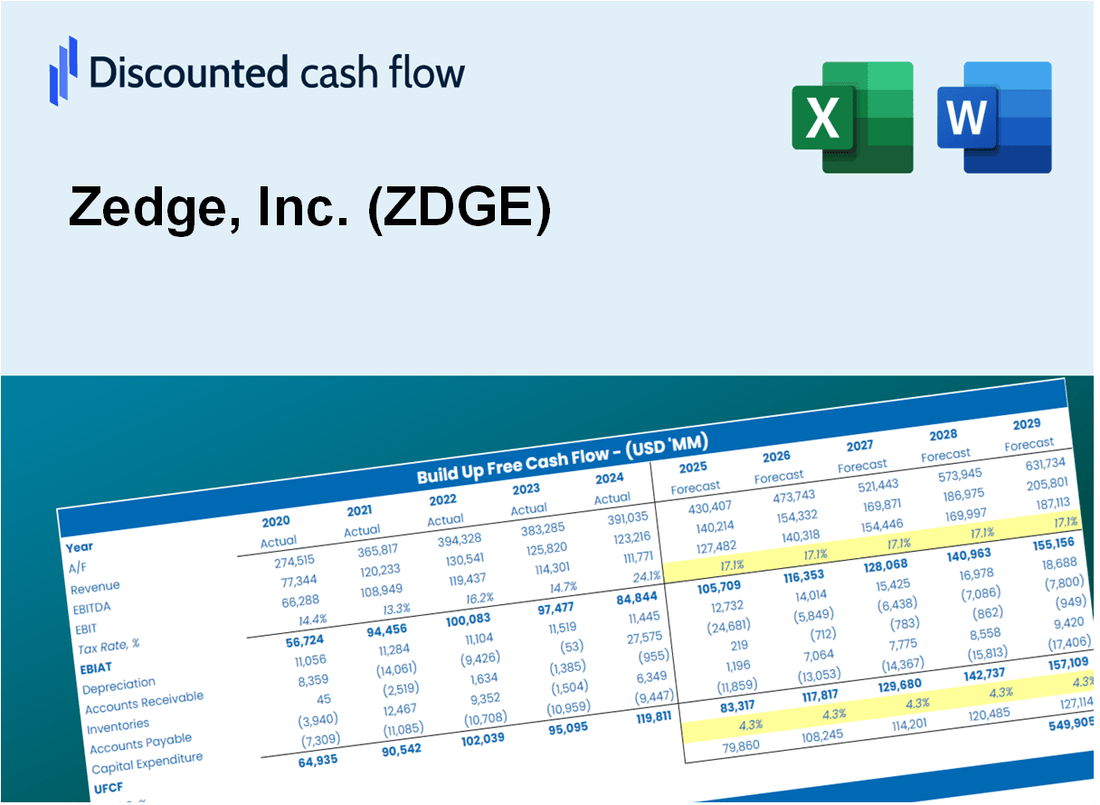
Discounted Cash Flow (DCF) - (USD MM)
| Year | AY1 2021 |
AY2 2022 |
AY3 2023 |
AY4 2024 |
AY5 2025 |
FY1 2026 |
FY2 2027 |
FY3 2028 |
FY4 2029 |
FY5 2030 |
|---|---|---|---|---|---|---|---|---|---|---|
| Revenue | 19.6 | 26.5 | 27.2 | 30.1 | 29.4 | 32.8 | 36.6 | 40.9 | 45.6 | 50.9 |
| Revenue Growth, % | 0 | 35.65 | 2.62 | 10.46 | -2.3 | 11.61 | 11.61 | 11.61 | 11.61 | 11.61 |
| EBITDA | 9.3 | 13.6 | -3.3 | -8.9 | -1.6 | 3.4 | 3.8 | 4.2 | 4.7 | 5.3 |
| EBITDA, % | 47.56 | 51.13 | -12.1 | -29.63 | -5.33 | 10.33 | 10.33 | 10.33 | 10.33 | 10.33 |
| Depreciation | 1.3 | 2.0 | 3.3 | 2.5 | 1.1 | 2.5 | 2.8 | 3.1 | 3.5 | 3.9 |
| Depreciation, % | 6.44 | 7.41 | 12 | 8.16 | 3.91 | 7.58 | 7.58 | 7.58 | 7.58 | 7.58 |
| EBIT | 8.0 | 11.6 | -6.6 | -11.4 | -2.7 | .9 | 1.0 | 1.1 | 1.3 | 1.4 |
| EBIT, % | 41.12 | 43.72 | -24.1 | -37.78 | -9.24 | 2.74 | 2.74 | 2.74 | 2.74 | 2.74 |
| Total Cash | 24.9 | 17.1 | 18.1 | 20.0 | 18.6 | 23.7 | 26.4 | 29.5 | 32.9 | 36.7 |
| Total Cash, percent | .0 | .0 | .0 | .0 | .0 | .0 | .0 | .0 | .0 | .0 |
| Account Receivables | 2.5 | 2.4 | 2.9 | 3.4 | 3.2 | 3.6 | 4.0 | 4.5 | 5.0 | 5.6 |
| Account Receivables, % | 13.01 | 9.08 | 10.58 | 11.32 | 10.76 | 10.95 | 10.95 | 10.95 | 10.95 | 10.95 |
| Inventories | .0 | .0 | .0 | .0 | .0 | .0 | .0 | .0 | .0 | .0 |
| Inventories, % | 0 | 0 | 0 | 0 | 0 | 0 | 0 | 0 | 0 | 0 |
| Accounts Payable | .6 | 1.2 | .7 | 1.1 | 1.5 | 1.2 | 1.4 | 1.5 | 1.7 | 1.9 |
| Accounts Payable, % | 2.99 | 4.45 | 2.46 | 3.7 | 5 | 3.72 | 3.72 | 3.72 | 3.72 | 3.72 |
| Capital Expenditure | -.7 | -.6 | -1.5 | -1.2 | -.1 | -1.0 | -1.1 | -1.2 | -1.4 | -1.6 |
| Capital Expenditure, % | -3.34 | -2.3 | -5.36 | -3.97 | -0.28233 | -3.05 | -3.05 | -3.05 | -3.05 | -3.05 |
| Tax Rate, % | 11.96 | 11.96 | 11.96 | 11.96 | 11.96 | 11.96 | 11.96 | 11.96 | 11.96 | 11.96 |
| EBITAT | 8.2 | 9.7 | -6.1 | -9.2 | -2.4 | .8 | .9 | 1.0 | 1.1 | 1.2 |
| Depreciation | ||||||||||
| Changes in Account Receivables | ||||||||||
| Changes in Inventories | ||||||||||
| Changes in Accounts Payable | ||||||||||
| Capital Expenditure | ||||||||||
| UFCF | 6.9 | 11.8 | -5.3 | -8.0 | -.7 | 1.6 | 2.3 | 2.5 | 2.8 | 3.2 |
| WACC, % | 10.86 | 10.85 | 10.86 | 10.85 | 10.86 | 10.86 | 10.86 | 10.86 | 10.86 | 10.86 |
| PV UFCF | ||||||||||
| SUM PV UFCF | 8.9 | |||||||||
| Long Term Growth Rate, % | 0.50 | |||||||||
| Free cash flow (T + 1) | 3 | |||||||||
| Terminal Value | 31 | |||||||||
| Present Terminal Value | 18 | |||||||||
| Enterprise Value | 27 | |||||||||
| Net Debt | -18 | |||||||||
| Equity Value | 46 | |||||||||
| Diluted Shares Outstanding, MM | 14 | |||||||||
| Equity Value Per Share | 3.33 |
What You Will Get
- Genuine Zedge Data: Preloaded financials – from revenue to EBIT – based on actual and projected figures.
- Complete Customization: Modify all essential parameters (yellow cells) such as WACC, growth %, and tax rates.
- Instant Valuation Updates: Automatic recalculations to assess the impact of changes on Zedge’s fair value.
- Flexible Excel Template: Designed for quick edits, scenario testing, and comprehensive projections.
- Efficient and Precise: Eliminate the need to build models from scratch while ensuring accuracy and adaptability.
Key Features
- 🔍 Real-Life ZDGE Financials: Pre-filled historical and projected data for Zedge, Inc.
- ✏️ Fully Customizable Inputs: Adjust all critical parameters (yellow cells) such as WACC, growth %, and tax rates.
- 📊 Professional DCF Valuation: Built-in formulas calculate Zedge’s intrinsic value using the Discounted Cash Flow method.
- ⚡ Instant Results: Visualize Zedge’s valuation instantly after making changes.
- Scenario Analysis: Test and compare outcomes for various financial assumptions side-by-side.
How It Works
- Step 1: Download the Excel file.
- Step 2: Review Zedge, Inc.'s pre-filled financial data and forecasts.
- Step 3: Modify key inputs such as user growth, marketing expenses, and subscription rates (highlighted cells).
- Step 4: Observe the DCF model update in real-time as you adjust your assumptions.
- Step 5: Evaluate the outputs and utilize the results for your investment strategies.
Why Choose This Calculator for Zedge, Inc. (ZDGE)?
- Designed for Experts: A sophisticated tool tailored for analysts, CFOs, and industry consultants.
- Accurate Data: Zedge’s historical and forecasted financials preloaded for precision.
- Flexible Scenario Analysis: Effortlessly simulate various forecasts and assumptions.
- Insightful Outputs: Automatically computes intrinsic value, NPV, and essential metrics.
- User-Friendly: Step-by-step guidance ensures a smooth navigation through the process.
Who Should Use This Product?
- Investors: Evaluate Zedge’s market performance before making investment decisions.
- CFOs and Financial Analysts: Optimize valuation methodologies and assess future projections.
- Startup Founders: Understand the valuation strategies of successful companies like Zedge.
- Consultants: Provide comprehensive valuation analyses for clients in the tech sector.
- Students and Educators: Utilize current data to explore and teach valuation principles.
What the Template Contains
- Historical Data: Includes Zedge, Inc.'s past financials and baseline forecasts.
- DCF and Levered DCF Models: Detailed templates to calculate Zedge, Inc.'s intrinsic value.
- WACC Sheet: Pre-built calculations for Weighted Average Cost of Capital.
- Editable Inputs: Modify key drivers like growth rates, EBITDA %, and CAPEX assumptions.
- Quarterly and Annual Statements: A complete breakdown of Zedge, Inc.'s financials.
- Interactive Dashboard: Visualize valuation results and projections dynamically.
Disclaimer
All information, articles, and product details provided on this website are for general informational and educational purposes only. We do not claim any ownership over, nor do we intend to infringe upon, any trademarks, copyrights, logos, brand names, or other intellectual property mentioned or depicted on this site. Such intellectual property remains the property of its respective owners, and any references here are made solely for identification or informational purposes, without implying any affiliation, endorsement, or partnership.
We make no representations or warranties, express or implied, regarding the accuracy, completeness, or suitability of any content or products presented. Nothing on this website should be construed as legal, tax, investment, financial, medical, or other professional advice. In addition, no part of this site—including articles or product references—constitutes a solicitation, recommendation, endorsement, advertisement, or offer to buy or sell any securities, franchises, or other financial instruments, particularly in jurisdictions where such activity would be unlawful.
All content is of a general nature and may not address the specific circumstances of any individual or entity. It is not a substitute for professional advice or services. Any actions you take based on the information provided here are strictly at your own risk. You accept full responsibility for any decisions or outcomes arising from your use of this website and agree to release us from any liability in connection with your use of, or reliance upon, the content or products found herein.