
|
Avaliação DCF da Zai Lab Limited (ZLAB) |
Totalmente Editável: Adapte-Se Às Suas Necessidades No Excel Ou Planilhas
Design Profissional: Modelos Confiáveis E Padrão Da Indústria
Pré-Construídos Para Uso Rápido E Eficiente
Compatível com MAC/PC, totalmente desbloqueado
Não É Necessária Experiência; Fácil De Seguir
Zai Lab Limited (ZLAB) Bundle
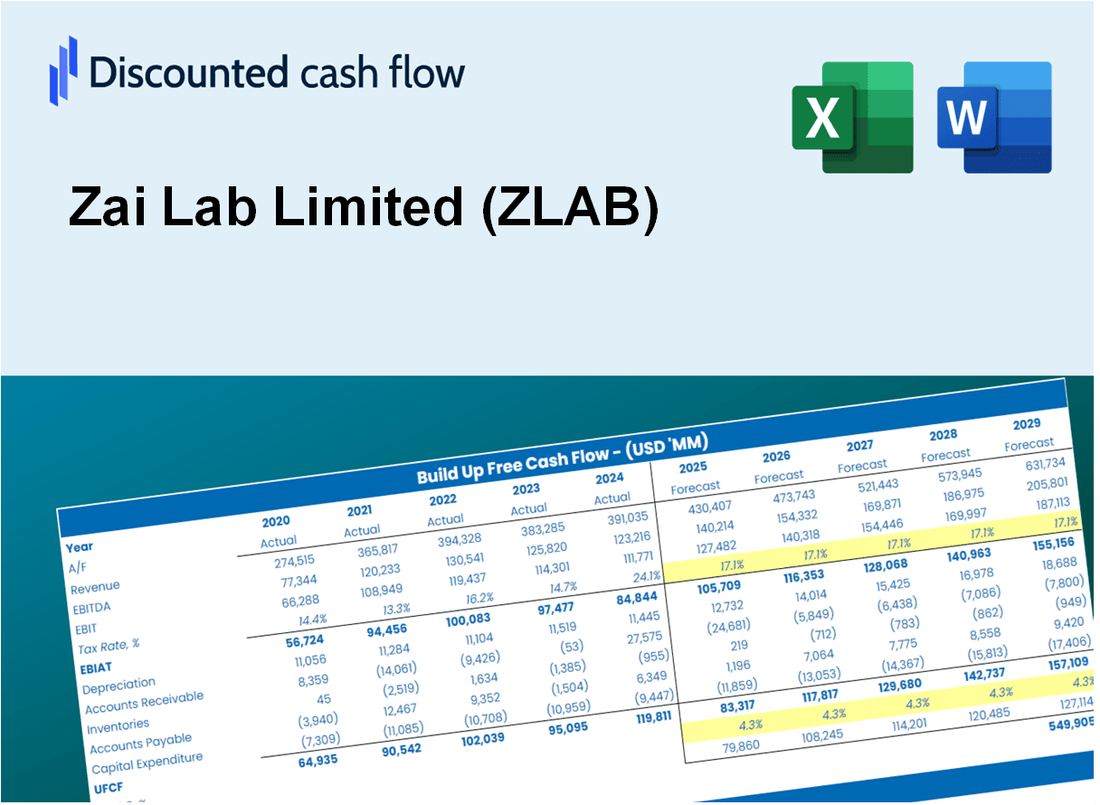
Obtenha informações sobre sua análise de avaliação do Zai Lab Limited (ZLAB) com nossa poderosa calculadora DCF! Pré -carregado com dados reais do ZLAB, este modelo do Excel permite ajustar as previsões e suposições para determinar com precisão o valor intrínseco da Zai Lab Limited.
What You Will Receive
- Comprehensive Financial Model: Zai Lab Limited’s actual data provides a reliable DCF valuation.
- Complete Forecast Flexibility: Modify revenue growth, profit margins, WACC, and other essential factors.
- Real-Time Calculations: Instant updates allow you to view results as you make adjustments.
- Professional-Grade Template: A polished Excel file crafted for high-quality valuation presentations.
- Adaptable and Reusable: Designed for versatility, enabling ongoing use for in-depth forecasting.
Key Features
- Customizable Financial Inputs: Adjust essential metrics such as revenue projections, operating margins, and R&D expenditures.
- Instant DCF Valuation: Quickly computes intrinsic value, net present value, and additional financial metrics.
- High-Precision Accuracy: Leverages Zai Lab's (ZLAB) actual financial data for dependable valuation results.
- Effortless Scenario Testing: Explore various assumptions and analyze results with ease.
- Efficiency Booster: Streamline your valuation process without the hassle of constructing intricate models from the ground up.
How It Works
- Download: Get the pre-prepared Excel file containing Zai Lab Limited's (ZLAB) financial data.
- Customize: Modify projections, including revenue growth, EBITDA %, and WACC.
- Update Automatically: The intrinsic value and NPV calculations refresh in real-time.
- Test Scenarios: Generate various forecasts and instantly compare the results.
- Make Decisions: Leverage the valuation findings to inform your investment strategy.
Why Choose This Calculator for Zai Lab Limited (ZLAB)?
- Tailored for Experts: A sophisticated tool designed for analysts, investors, and financial advisors.
- Accurate Data: Zai Lab's historical and projected financials are preloaded for precision.
- Flexible Scenario Analysis: Effortlessly test various forecasts and assumptions.
- Comprehensive Outputs: Instantly calculates intrinsic value, NPV, and essential metrics.
- User-Friendly: Step-by-step guidance ensures a smooth experience.
Who Should Use This Product?
- Professional Investors: Develop comprehensive and accurate valuation models for portfolio assessment related to Zai Lab Limited (ZLAB).
- Corporate Finance Teams: Evaluate valuation scenarios to inform strategic decisions within their organizations regarding Zai Lab Limited (ZLAB).
- Consultants and Advisors: Deliver precise valuation insights to clients considering investments in Zai Lab Limited (ZLAB).
- Students and Educators: Utilize real-world data to enhance learning and practice in financial modeling with a focus on Zai Lab Limited (ZLAB).
- Biotech Enthusiasts: Gain insights into how biotech companies like Zai Lab Limited (ZLAB) are assessed in the financial markets.
What the Template Contains
- Operating and Balance Sheet Data: Pre-filled Zai Lab Limited (ZLAB) historical data and forecasts, including revenue, EBITDA, EBIT, and capital expenditures.
- WACC Calculation: A dedicated sheet for Weighted Average Cost of Capital (WACC), including parameters like Beta, risk-free rate, and share price.
- DCF Valuation (Unlevered and Levered): Editable Discounted Cash Flow models showing intrinsic value with detailed calculations.
- Financial Statements: Pre-loaded financial statements (annual and quarterly) to support analysis.
- Key Ratios: Includes profitability, leverage, and efficiency ratios for Zai Lab Limited (ZLAB).
- Dashboard and Charts: Visual summary of valuation outputs and assumptions to analyze results easily.
Disclaimer
All information, articles, and product details provided on this website are for general informational and educational purposes only. We do not claim any ownership over, nor do we intend to infringe upon, any trademarks, copyrights, logos, brand names, or other intellectual property mentioned or depicted on this site. Such intellectual property remains the property of its respective owners, and any references here are made solely for identification or informational purposes, without implying any affiliation, endorsement, or partnership.
We make no representations or warranties, express or implied, regarding the accuracy, completeness, or suitability of any content or products presented. Nothing on this website should be construed as legal, tax, investment, financial, medical, or other professional advice. In addition, no part of this site—including articles or product references—constitutes a solicitation, recommendation, endorsement, advertisement, or offer to buy or sell any securities, franchises, or other financial instruments, particularly in jurisdictions where such activity would be unlawful.
All content is of a general nature and may not address the specific circumstances of any individual or entity. It is not a substitute for professional advice or services. Any actions you take based on the information provided here are strictly at your own risk. You accept full responsibility for any decisions or outcomes arising from your use of this website and agree to release us from any liability in connection with your use of, or reliance upon, the content or products found herein.