
|
Zentalis Pharmaceuticals, Inc. (ZNTL) Avaliação DCF |
Totalmente Editável: Adapte-Se Às Suas Necessidades No Excel Ou Planilhas
Design Profissional: Modelos Confiáveis E Padrão Da Indústria
Pré-Construídos Para Uso Rápido E Eficiente
Compatível com MAC/PC, totalmente desbloqueado
Não É Necessária Experiência; Fácil De Seguir
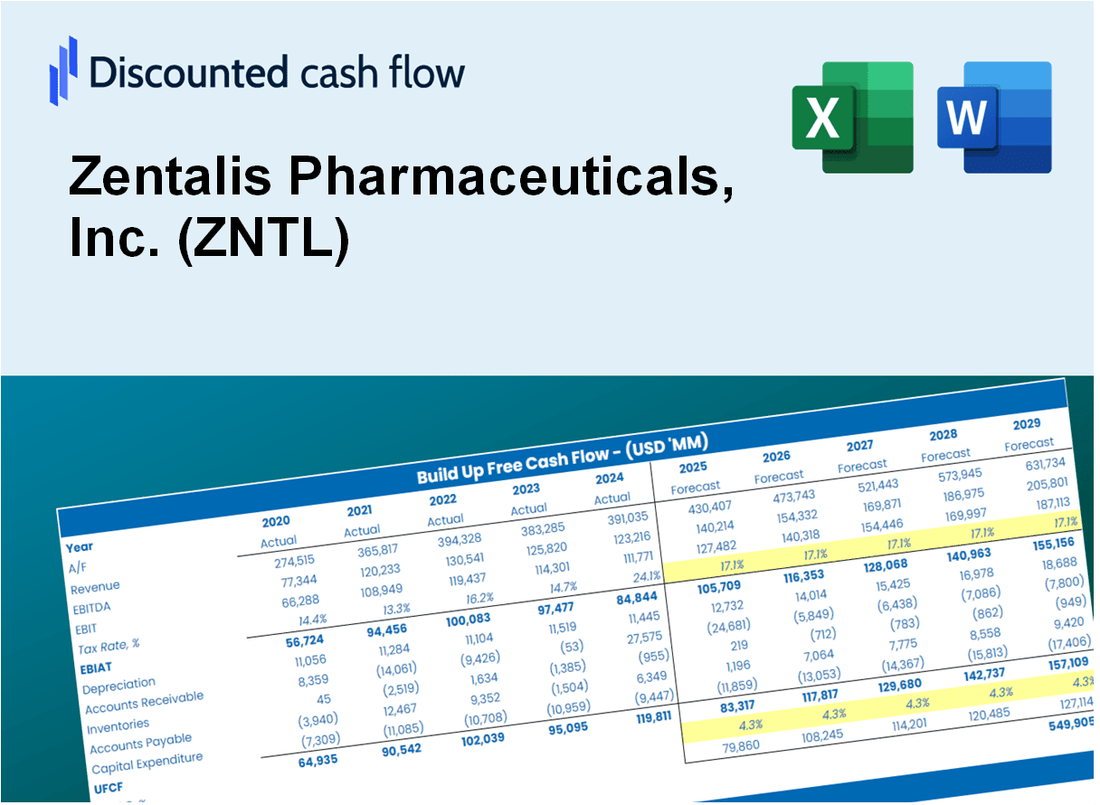
Zentalis Pharmaceuticals, Inc. (ZNTL) Bundle
Explore o Zentalis Pharmaceuticals, Inc. (ZNTL) Outlook financeiro com nossa calculadora DCF amigável! Digite suas projeções de crescimento, margens e despesas para calcular o valor intrínseco da Zentalis e informar suas decisões de investimento.
What You Will Get
- Real ZNTL Financial Data: Pre-filled with Zentalis Pharmaceuticals’ historical and projected data for precise analysis.
- Fully Editable Template: Modify key inputs like revenue growth, WACC, and EBITDA % with ease.
- Automatic Calculations: See Zentalis’ intrinsic value update instantly based on your changes.
- Professional Valuation Tool: Designed for investors, analysts, and consultants seeking accurate DCF results.
- User-Friendly Design: Simple structure and clear instructions for all experience levels.
Key Features
- Comprehensive DCF Calculator: Offers detailed unlevered and levered DCF valuation models tailored for Zentalis Pharmaceuticals, Inc. (ZNTL).
- WACC Tool: Features a pre-built Weighted Average Cost of Capital sheet with adjustable inputs specific to ZNTL.
- Customizable Forecast Assumptions: Easily adjust growth rates, capital expenditures, and discount rates relevant to Zentalis Pharmaceuticals.
- Integrated Financial Ratios: Evaluate profitability, leverage, and efficiency ratios for Zentalis Pharmaceuticals, Inc. (ZNTL).
- Visual Dashboard and Charts: Graphical representations summarize essential valuation metrics for straightforward analysis.
How It Works
- Step 1: Download the Excel file.
- Step 2: Review the pre-entered Zentalis Pharmaceuticals data (historical and projected).
- Step 3: Modify key assumptions (yellow cells) based on your analysis.
- Step 4: Observe automatic recalculations for Zentalis Pharmaceuticals’ intrinsic value.
- Step 5: Utilize the outputs for investment decisions or reporting.
Why Choose This Calculator?
- Accuracy: Utilizes real Zentalis Pharmaceuticals financials to guarantee data precision.
- Flexibility: Crafted for users to easily test and adjust inputs as needed.
- Time-Saving: Eliminate the complexities of constructing a DCF model from the ground up.
- Professional-Grade: Designed with CFO-level accuracy and user experience in focus.
- User-Friendly: Intuitive interface, suitable for individuals without extensive financial modeling skills.
Who Should Use Zentalis Pharmaceuticals, Inc. (ZNTL)?
- Pharmaceutical Investors: Make informed investment choices with our cutting-edge research and insights.
- Healthcare Analysts: Streamline your analysis with comprehensive reports on drug development and market potential.
- Consultants: Easily modify our findings for client briefings or strategic recommendations.
- Biotech Enthusiasts: Enhance your knowledge of pharmaceutical advancements and industry trends.
- Academics and Students: Utilize our resources as a valuable educational tool in pharmaceutical and business studies.
What the Template Contains
- Pre-Filled DCF Model: Zentalis Pharmaceuticals’ financial data preloaded for immediate use.
- WACC Calculator: Detailed calculations for Weighted Average Cost of Capital.
- Financial Ratios: Evaluate Zentalis Pharmaceuticals’ profitability, leverage, and efficiency.
- Editable Inputs: Change assumptions such as growth, margins, and CAPEX to fit your scenarios.
- Financial Statements: Annual and quarterly reports to support detailed analysis.
- Interactive Dashboard: Easily visualize key valuation metrics and results.
Disclaimer
All information, articles, and product details provided on this website are for general informational and educational purposes only. We do not claim any ownership over, nor do we intend to infringe upon, any trademarks, copyrights, logos, brand names, or other intellectual property mentioned or depicted on this site. Such intellectual property remains the property of its respective owners, and any references here are made solely for identification or informational purposes, without implying any affiliation, endorsement, or partnership.
We make no representations or warranties, express or implied, regarding the accuracy, completeness, or suitability of any content or products presented. Nothing on this website should be construed as legal, tax, investment, financial, medical, or other professional advice. In addition, no part of this site—including articles or product references—constitutes a solicitation, recommendation, endorsement, advertisement, or offer to buy or sell any securities, franchises, or other financial instruments, particularly in jurisdictions where such activity would be unlawful.
All content is of a general nature and may not address the specific circumstances of any individual or entity. It is not a substitute for professional advice or services. Any actions you take based on the information provided here are strictly at your own risk. You accept full responsibility for any decisions or outcomes arising from your use of this website and agree to release us from any liability in connection with your use of, or reliance upon, the content or products found herein.