
|
Sands China Ltd. (1928.hk) تقييم DCF |
Fully Editable: Tailor To Your Needs In Excel Or Sheets
Professional Design: Trusted, Industry-Standard Templates
Investor-Approved Valuation Models
MAC/PC Compatible, Fully Unlocked
No Expertise Is Needed; Easy To Follow
Sands China Ltd. (1928.HK) Bundle
سواء كنت مستثمرًا أو محللًا ، فإن حاسبة Sands China Ltd. (1928HK) DCF هي موردك للتقييم الدقيق. مزود ببيانات حقيقية من Sands China Ltd. ، يمكنك ضبط التنبؤات ومراقبة التأثيرات في الوقت الحقيقي.
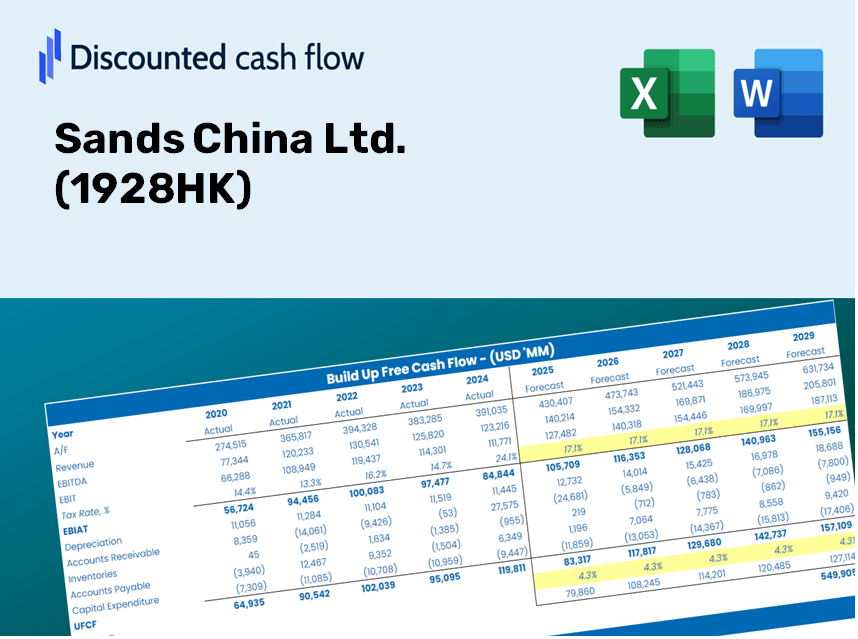
Discounted Cash Flow (DCF) - (USD MM)
| Year | AY1 2020 |
AY2 2021 |
AY3 2022 |
AY4 2023 |
AY5 2024 |
FY1 2025 |
FY2 2026 |
FY3 2027 |
FY4 2028 |
FY5 2029 |
|---|---|---|---|---|---|---|---|---|---|---|
| Revenue | 13,110.0 | 22,334.5 | 12,472.8 | 50,777.1 | 55,020.2 | 73,529.5 | 98,265.4 | 131,322.7 | 175,500.8 | 234,540.8 |
| Revenue Growth, % | 0 | 70.36 | -44.15 | 307.1 | 8.36 | 33.64 | 33.64 | 33.64 | 33.64 | 33.64 |
| EBITDA | -4,328.6 | 194.3 | -3,318.3 | 15,705.6 | 16,677.0 | 366.1 | 489.3 | 653.9 | 873.8 | 1,167.8 |
| EBITDA, % | -33.02 | 0.86987 | -26.6 | 30.93 | 30.31 | 0.49791 | 0.49791 | 0.49791 | 0.49791 | 0.49791 |
| Depreciation | 5,129.0 | 5,696.3 | 5,828.4 | 6,022.7 | 5,859.5 | 19,686.3 | 26,309.0 | 35,159.5 | 46,987.5 | 62,794.5 |
| Depreciation, % | 39.12 | 25.5 | 46.73 | 11.86 | 10.65 | 26.77 | 26.77 | 26.77 | 26.77 | 26.77 |
| EBIT | -9,457.6 | -5,502.0 | -9,146.7 | 9,682.9 | 10,817.5 | -19,320.2 | -25,819.7 | -34,505.7 | -46,113.7 | -61,626.7 |
| EBIT, % | -72.14 | -24.63 | -73.33 | 19.07 | 19.66 | -26.28 | -26.28 | -26.28 | -26.28 | -26.28 |
| Total Cash | 6,691.0 | 5,268.9 | 6,139.3 | 10,576.6 | 15,309.3 | 25,368.2 | 33,902.3 | 45,307.3 | 60,549.1 | 80,918.3 |
| Total Cash, percent | .0 | .0 | .0 | .0 | .0 | .0 | .0 | .0 | .0 | .0 |
| Account Receivables | 932.5 | 901.5 | 629.5 | 1,725.2 | 1,398.8 | 3,255.3 | 4,350.4 | 5,814.0 | 7,769.8 | 10,383.6 |
| Account Receivables, % | 7.11 | 4.04 | 5.05 | 3.4 | 2.54 | 4.43 | 4.43 | 4.43 | 4.43 | 4.43 |
| Inventories | 116.6 | 116.6 | 147.7 | 202.1 | 217.6 | 498.3 | 665.9 | 889.9 | 1,189.3 | 1,589.4 |
| Inventories, % | 0.88915 | 0.52192 | 1.18 | 0.39792 | 0.39548 | 0.67765 | 0.67765 | 0.67765 | 0.67765 | 0.67765 |
| Accounts Payable | 9,061.2 | 7,576.9 | 6,473.4 | 9,177.8 | 10,429.0 | 28,231.1 | 37,728.3 | 50,420.4 | 67,382.3 | 90,050.2 |
| Accounts Payable, % | 69.12 | 33.92 | 51.9 | 18.07 | 18.95 | 38.39 | 38.39 | 38.39 | 38.39 | 38.39 |
| Capital Expenditure | -7,918.9 | -4,383.0 | -1,577.6 | -1,562.0 | -6,698.8 | -15,871.6 | -21,210.9 | -28,346.4 | -37,882.4 | -50,626.4 |
| Capital Expenditure, % | -60.4 | -19.62 | -12.65 | -3.08 | -12.18 | -21.59 | -21.59 | -21.59 | -21.59 | -21.59 |
| Tax Rate, % | -3.47 | -3.47 | -3.47 | -3.47 | -3.47 | -3.47 | -3.47 | -3.47 | -3.47 | -3.47 |
| EBITAT | -9,558.0 | -5,517.8 | -9,112.2 | 9,042.6 | 11,192.4 | -19,050.1 | -25,458.7 | -34,023.2 | -45,469.0 | -60,765.1 |
| Depreciation | ||||||||||
| Changes in Account Receivables | ||||||||||
| Changes in Inventories | ||||||||||
| Changes in Accounts Payable | ||||||||||
| Capital Expenditure | ||||||||||
| UFCF | -4,335.7 | -5,657.7 | -5,723.9 | 15,057.6 | 11,915.1 | 429.6 | -12,126.2 | -16,205.6 | -21,657.2 | -28,942.9 |
| WACC, % | 6.14 | 6.14 | 6.14 | 6.06 | 6.14 | 6.12 | 6.12 | 6.12 | 6.12 | 6.12 |
| PV UFCF | ||||||||||
| SUM PV UFCF | -62,501.8 | |||||||||
| Long Term Growth Rate, % | 2.00 | |||||||||
| Free cash flow (T + 1) | -29,522 | |||||||||
| Terminal Value | -716,197 | |||||||||
| Present Terminal Value | -532,114 | |||||||||
| Enterprise Value | -594,616 | |||||||||
| Net Debt | 48,096 | |||||||||
| Equity Value | -642,712 | |||||||||
| Diluted Shares Outstanding, MM | 8,093 | |||||||||
| Equity Value Per Share | -79.41 |
ما ستتلقاه
- أصيلة 1928HK المالية: يتميز بالبيانات التاريخية والتوقعات للتقييم الدقيق.
- مدخلات قابلة للتخصيص: اضبط WACC ومعدلات الضرائب ونمو الإيرادات والنفقات الرأسمالية حسب الحاجة.
- الحسابات الديناميكية: يحسب تلقائيًا القيمة الجوهرية و NPV.
- تحليل السيناريو: استكشف سيناريوهات مختلفة لتقييم الأداء المستقبلي للصين في الصين.
- تصميم سهل الاستخدام ومهني: مصمم خصيصًا للخبراء مع بقاء ودودين للوافدين الجدد.
الميزات الرئيسية
- البيانات التي تم تحميلها مسبقًا: البيانات المالية التاريخية لـ Sands China Ltd. والتوقعات المليئة مسبقًا.
- مدخلات قابلة للتعديل بالكامل: تعديل WACC ، ومعدلات الضرائب ، ونمو الإيرادات ، وهامش EBITDA حسب الحاجة.
- النتائج الفورية: شاهد تحديث القيمة الجوهرية لـ Sands China Ltd. في الوقت الفعلي.
- واضحة المخرجات المرئية: توضح مخططات لوحة القيادة نتائج التقييم والمقاييس الأساسية.
- بنيت للدقة: أداة من الدرجة المهنية المصممة للمحللين والمستثمرين والمهنيين الماليين.
كيف تعمل
- تحميل: احصل على ملف Excel المُعرف مسبقًا الذي يحتوي على بيانات مالية Sands China Ltd. (1928hk).
- تخصيص: توقعات الخياط مثل نمو الإيرادات ، EBITDA ٪ ، و WACC لتناسب تحليلك.
- التحديث تلقائيًا: تحديث القيمة الجوهرية وحسابات NPV في الوقت الفعلي للدقة.
- سيناريوهات الاختبار: تطوير توقعات مختلفة وتقييم النتائج المختلفة على الفور.
- اتخاذ القرارات: الاستفادة من نتائج التقييم لإبلاغ استراتيجية الاستثمار الخاصة بك.
لماذا حدد هذه الآلة الحاسبة؟
- سهل الاستخدام: مصمم لكل من المبتدئين والمهنيين المتمرسين.
- مدخلات قابلة للتخصيص: تعديل المتغيرات دون عناء لتناسب تحليلك.
- تحديثات الوقت الحقيقي: شاهد تغييرات فورية على تقييم Sands China Ltd. (1928hk) أثناء تعديل المدخلات.
- تم تكوينه مسبقًا: يأتي مع SANDS China Ltd. (1928HK) البيانات المالية الفعلية للتقييم السريع.
- اعتمد عليه الخبراء: أداة الانتقال للمستثمرين والمحللين في اتخاذ خيارات مستنيرة.
من يجب أن يفكر في استخدام هذا المنتج؟
- المستثمرون: تقييم تقييم Sands China Ltd. (1928HK) قبل إجراء صفقات الأسهم.
- الماليين والمحللين الماليين: تحسين عمليات التقييم وتقييم التوقعات المالية.
- مؤسسو الشركات الناشئة: اكتشف طرق التقييم المستخدمة للشركات القائمة مثل Sands China Ltd. (1928hk).
- الاستشاريون: تقديم تقارير تقييم شاملة لعملائك بناءً على Sands China Ltd. (1928HK).
- الطلاب والمعلمين: الاستفادة من البيانات الحقيقية من Sands China Ltd. (1928hk) لتعزيز تقنيات تقييم التعلم والممارسة.
محتويات القالب
- البيانات التاريخية: يوفر شاملة overview من Sands China Ltd. الأداء المالي السابق والتنبؤات التأسيسية.
- نماذج DCF و Ruvered DCF: قوالب متعمقة لتقييم القيمة الجوهرية لـ Sands China Ltd. (1928hk).
- ورقة WACC: الحسابات المسببة للتشكيل لمتوسط تكلفة رأس المال المرجح.
- مدخلات قابلة للتحرير: تخصيص المتغيرات الرئيسية مثل توقعات النمو ، وافتراضات EBITDA ٪ ، وافتراضات Capex.
- البيانات الفصلية والسنوية: تحليل شامل للبيانات المالية لـ Sands China Ltd.
- لوحة القيادة التفاعلية: تصور ديناميكيا نتائج التقييم والتوقعات.
Disclaimer
All information, articles, and product details provided on this website are for general informational and educational purposes only. We do not claim any ownership over, nor do we intend to infringe upon, any trademarks, copyrights, logos, brand names, or other intellectual property mentioned or depicted on this site. Such intellectual property remains the property of its respective owners, and any references here are made solely for identification or informational purposes, without implying any affiliation, endorsement, or partnership.
We make no representations or warranties, express or implied, regarding the accuracy, completeness, or suitability of any content or products presented. Nothing on this website should be construed as legal, tax, investment, financial, medical, or other professional advice. In addition, no part of this site—including articles or product references—constitutes a solicitation, recommendation, endorsement, advertisement, or offer to buy or sell any securities, franchises, or other financial instruments, particularly in jurisdictions where such activity would be unlawful.
All content is of a general nature and may not address the specific circumstances of any individual or entity. It is not a substitute for professional advice or services. Any actions you take based on the information provided here are strictly at your own risk. You accept full responsibility for any decisions or outcomes arising from your use of this website and agree to release us from any liability in connection with your use of, or reliance upon, the content or products found herein.