
|
Sands China Ltd. (1928.HK) Valoración de DCF |
Completamente Editable: Adáptelo A Sus Necesidades En Excel O Sheets
Diseño Profesional: Plantillas Confiables Y Estándares De La Industria
Predeterminadas Para Un Uso Rápido Y Eficiente
Compatible con MAC / PC, completamente desbloqueado
No Se Necesita Experiencia; Fáciles De Seguir
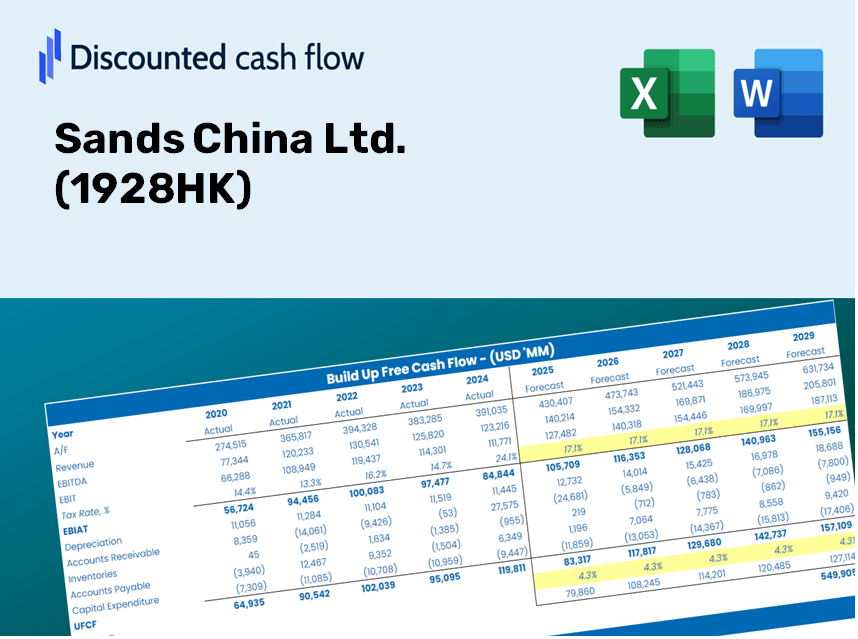
Sands China Ltd. (1928.HK) Bundle
Ya sea que sea un inversionista o analista, esta calculadora DCF de Sands China Ltd. (1928HK) es su recurso de referencia para una valoración precisa. Equipado con datos reales de Sands China Ltd., puede ajustar los pronósticos y observar los efectos en tiempo real.
Discounted Cash Flow (DCF) - (USD MM)
| Year | AY1 2020 |
AY2 2021 |
AY3 2022 |
AY4 2023 |
AY5 2024 |
FY1 2025 |
FY2 2026 |
FY3 2027 |
FY4 2028 |
FY5 2029 |
|---|---|---|---|---|---|---|---|---|---|---|
| Revenue | 13,110.0 | 22,334.5 | 12,472.8 | 50,777.1 | 55,020.2 | 73,529.5 | 98,265.4 | 131,322.7 | 175,500.8 | 234,540.8 |
| Revenue Growth, % | 0 | 70.36 | -44.15 | 307.1 | 8.36 | 33.64 | 33.64 | 33.64 | 33.64 | 33.64 |
| EBITDA | -4,328.6 | 194.3 | -3,318.3 | 15,705.6 | 16,677.0 | 366.1 | 489.3 | 653.9 | 873.8 | 1,167.8 |
| EBITDA, % | -33.02 | 0.86987 | -26.6 | 30.93 | 30.31 | 0.49791 | 0.49791 | 0.49791 | 0.49791 | 0.49791 |
| Depreciation | 5,129.0 | 5,696.3 | 5,828.4 | 6,022.7 | 5,859.5 | 19,686.3 | 26,309.0 | 35,159.5 | 46,987.5 | 62,794.5 |
| Depreciation, % | 39.12 | 25.5 | 46.73 | 11.86 | 10.65 | 26.77 | 26.77 | 26.77 | 26.77 | 26.77 |
| EBIT | -9,457.6 | -5,502.0 | -9,146.7 | 9,682.9 | 10,817.5 | -19,320.2 | -25,819.7 | -34,505.7 | -46,113.7 | -61,626.7 |
| EBIT, % | -72.14 | -24.63 | -73.33 | 19.07 | 19.66 | -26.28 | -26.28 | -26.28 | -26.28 | -26.28 |
| Total Cash | 6,691.0 | 5,268.9 | 6,139.3 | 10,576.6 | 15,309.3 | 25,368.2 | 33,902.3 | 45,307.3 | 60,549.1 | 80,918.3 |
| Total Cash, percent | .0 | .0 | .0 | .0 | .0 | .0 | .0 | .0 | .0 | .0 |
| Account Receivables | 932.5 | 901.5 | 629.5 | 1,725.2 | 1,398.8 | 3,255.3 | 4,350.4 | 5,814.0 | 7,769.8 | 10,383.6 |
| Account Receivables, % | 7.11 | 4.04 | 5.05 | 3.4 | 2.54 | 4.43 | 4.43 | 4.43 | 4.43 | 4.43 |
| Inventories | 116.6 | 116.6 | 147.7 | 202.1 | 217.6 | 498.3 | 665.9 | 889.9 | 1,189.3 | 1,589.4 |
| Inventories, % | 0.88915 | 0.52192 | 1.18 | 0.39792 | 0.39548 | 0.67765 | 0.67765 | 0.67765 | 0.67765 | 0.67765 |
| Accounts Payable | 9,061.2 | 7,576.9 | 6,473.4 | 9,177.8 | 10,429.0 | 28,231.1 | 37,728.3 | 50,420.4 | 67,382.3 | 90,050.2 |
| Accounts Payable, % | 69.12 | 33.92 | 51.9 | 18.07 | 18.95 | 38.39 | 38.39 | 38.39 | 38.39 | 38.39 |
| Capital Expenditure | -7,918.9 | -4,383.0 | -1,577.6 | -1,562.0 | -6,698.8 | -15,871.6 | -21,210.9 | -28,346.4 | -37,882.4 | -50,626.4 |
| Capital Expenditure, % | -60.4 | -19.62 | -12.65 | -3.08 | -12.18 | -21.59 | -21.59 | -21.59 | -21.59 | -21.59 |
| Tax Rate, % | -3.47 | -3.47 | -3.47 | -3.47 | -3.47 | -3.47 | -3.47 | -3.47 | -3.47 | -3.47 |
| EBITAT | -9,558.0 | -5,517.8 | -9,112.2 | 9,042.6 | 11,192.4 | -19,050.1 | -25,458.7 | -34,023.2 | -45,469.0 | -60,765.1 |
| Depreciation | ||||||||||
| Changes in Account Receivables | ||||||||||
| Changes in Inventories | ||||||||||
| Changes in Accounts Payable | ||||||||||
| Capital Expenditure | ||||||||||
| UFCF | -4,335.7 | -5,657.7 | -5,723.9 | 15,057.6 | 11,915.1 | 429.6 | -12,126.2 | -16,205.6 | -21,657.2 | -28,942.9 |
| WACC, % | 6.14 | 6.14 | 6.14 | 6.06 | 6.14 | 6.12 | 6.12 | 6.12 | 6.12 | 6.12 |
| PV UFCF | ||||||||||
| SUM PV UFCF | -62,501.8 | |||||||||
| Long Term Growth Rate, % | 2.00 | |||||||||
| Free cash flow (T + 1) | -29,522 | |||||||||
| Terminal Value | -716,197 | |||||||||
| Present Terminal Value | -532,114 | |||||||||
| Enterprise Value | -594,616 | |||||||||
| Net Debt | 48,096 | |||||||||
| Equity Value | -642,712 | |||||||||
| Diluted Shares Outstanding, MM | 8,093 | |||||||||
| Equity Value Per Share | -79.41 |
What You'll Receive
- Authentic 1928HK Financials: Features historical data and forecasts for precise valuation.
- Customizable Inputs: Adjust WACC, tax rates, revenue growth, and capital expenditures as needed.
- Dynamic Calculations: Automatically computes intrinsic value and NPV.
- Scenario Analysis: Explore various scenarios to assess Sands China's future performance.
- User-Friendly and Professional Design: Tailored for experts while remaining approachable for newcomers.
Key Features
- Pre-Loaded Data: Sands China Ltd.’s historical financial statements and pre-filled forecasts.
- Fully Adjustable Inputs: Modify WACC, tax rates, revenue growth, and EBITDA margins as needed.
- Instant Results: Watch Sands China Ltd.’s intrinsic value update in real time.
- Clear Visual Outputs: Dashboard charts illustrate valuation results and essential metrics.
- Built for Accuracy: A professional-grade tool designed for analysts, investors, and finance professionals.
How It Works
- Download: Obtain the pre-prepared Excel file containing Sands China Ltd.'s (1928HK) financial data.
- Customize: Tailor forecasts such as revenue growth, EBITDA %, and WACC to fit your analysis.
- Update Automatically: The intrinsic value and NPV calculations refresh in real-time for accuracy.
- Test Scenarios: Develop various projections and instantly assess different outcomes.
- Make Decisions: Leverage the valuation results to inform your investment strategy.
Why Select This Calculator?
- User-Friendly: Tailored for both novices and seasoned professionals.
- Customizable Inputs: Effortlessly adjust variables to suit your analysis.
- Real-Time Updates: Witness immediate changes to Sands China Ltd.'s (1928HK) valuation as you modify inputs.
- Pre-Configured: Comes with Sands China Ltd.'s (1928HK) actual financial data for swift evaluation.
- Relied Upon by Experts: A go-to tool for investors and analysts in making informed choices.
Who Should Consider Using This Product?
- Investors: Assess Sands China Ltd.'s (1928HK) valuation prior to making stock trades.
- CFOs and Financial Analysts: Optimize valuation processes and evaluate financial projections.
- Startup Founders: Discover the valuation methods used for established companies like Sands China Ltd. (1928HK).
- Consultants: Provide comprehensive valuation reports for your clients based on Sands China Ltd. (1928HK).
- Students and Educators: Utilize real data from Sands China Ltd. (1928HK) to enhance learning and practice valuation techniques.
Contents of the Template
- Historical Data: Provides a comprehensive overview of Sands China Ltd.’s past financial performance and foundational forecasts.
- DCF and Levered DCF Models: In-depth templates for assessing the intrinsic value of Sands China Ltd. (1928HK).
- WACC Sheet: Pre-configured calculations for the Weighted Average Cost of Capital.
- Editable Inputs: Customize key variables such as growth projections, EBITDA %, and CAPEX assumptions.
- Quarterly and Annual Statements: A thorough analysis of Sands China Ltd.’s financial statements.
- Interactive Dashboard: Dynamically visualize valuation outcomes and forecasts.
Disclaimer
All information, articles, and product details provided on this website are for general informational and educational purposes only. We do not claim any ownership over, nor do we intend to infringe upon, any trademarks, copyrights, logos, brand names, or other intellectual property mentioned or depicted on this site. Such intellectual property remains the property of its respective owners, and any references here are made solely for identification or informational purposes, without implying any affiliation, endorsement, or partnership.
We make no representations or warranties, express or implied, regarding the accuracy, completeness, or suitability of any content or products presented. Nothing on this website should be construed as legal, tax, investment, financial, medical, or other professional advice. In addition, no part of this site—including articles or product references—constitutes a solicitation, recommendation, endorsement, advertisement, or offer to buy or sell any securities, franchises, or other financial instruments, particularly in jurisdictions where such activity would be unlawful.
All content is of a general nature and may not address the specific circumstances of any individual or entity. It is not a substitute for professional advice or services. Any actions you take based on the information provided here are strictly at your own risk. You accept full responsibility for any decisions or outcomes arising from your use of this website and agree to release us from any liability in connection with your use of, or reliance upon, the content or products found herein.