
|
ألكساندر & Baldwin ، Inc. (Alex) DCF تقييم |
Fully Editable: Tailor To Your Needs In Excel Or Sheets
Professional Design: Trusted, Industry-Standard Templates
Investor-Approved Valuation Models
MAC/PC Compatible, Fully Unlocked
No Expertise Is Needed; Easy To Follow
Alexander & Baldwin, Inc. (ALEX) Bundle
قم بتقييم الكسندر & التوقعات المالية لشركة Baldwin، Inc. مثل الخبير! توفر لك حاسبة DCF (ALEX) هذه بيانات مالية مملوءة مسبقًا ومرونة كاملة لتعديل نمو الإيرادات و WACC والهوامش والافتراضات الأساسية الأخرى لتتماشى مع توقعاتك.
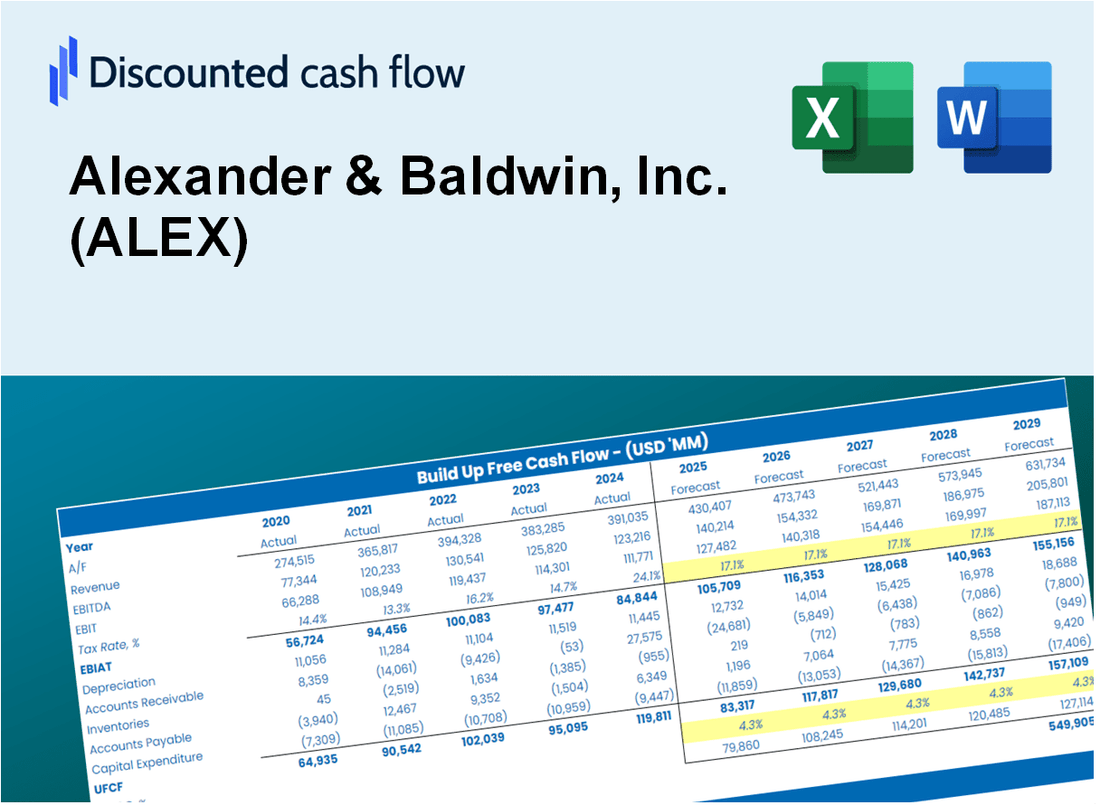
Discounted Cash Flow (DCF) - (USD MM)
| Year | AY1 2020 |
AY2 2021 |
AY3 2022 |
AY4 2023 |
AY5 2024 |
FY1 2025 |
FY2 2026 |
FY3 2027 |
FY4 2028 |
FY5 2029 |
|---|---|---|---|---|---|---|---|---|---|---|
| Revenue | 190.3 | 254.0 | 230.6 | 208.8 | 236.6 | 253.3 | 271.1 | 290.2 | 310.6 | 332.4 |
| Revenue Growth, % | 0 | 33.47 | -9.23 | -9.42 | 13.31 | 7.03 | 7.03 | 7.03 | 7.03 | 7.03 |
| EBITDA | 91.6 | 141.2 | 78.8 | 100.6 | 126.0 | 121.2 | 129.8 | 138.9 | 148.7 | 159.1 |
| EBITDA, % | 48.13 | 55.59 | 34.19 | 48.17 | 53.25 | 47.87 | 47.87 | 47.87 | 47.87 | 47.87 |
| Depreciation | 42.5 | 39.6 | 38.0 | 36.8 | 36.3 | 44.3 | 47.4 | 50.7 | 54.3 | 58.1 |
| Depreciation, % | 22.33 | 15.59 | 16.49 | 17.62 | 15.34 | 17.48 | 17.48 | 17.48 | 17.48 | 17.48 |
| EBIT | 49.1 | 101.6 | 40.8 | 63.8 | 89.7 | 77.0 | 82.4 | 88.2 | 94.4 | 101.0 |
| EBIT, % | 25.8 | 40 | 17.7 | 30.55 | 37.9 | 30.39 | 30.39 | 30.39 | 30.39 | 30.39 |
| Total Cash | 57.2 | 65.4 | 33.3 | 13.5 | 33.4 | 46.0 | 49.3 | 52.7 | 56.4 | 60.4 |
| Total Cash, percent | .0 | .0 | .0 | .0 | .0 | .0 | .0 | .0 | .0 | .0 |
| Account Receivables | 57.7 | 13.8 | 13.0 | 28.1 | 20.4 | 32.1 | 34.4 | 36.8 | 39.4 | 42.2 |
| Account Receivables, % | 30.32 | 5.43 | 5.64 | 13.46 | 8.62 | 12.69 | 12.69 | 12.69 | 12.69 | 12.69 |
| Inventories | 18.4 | 20.3 | 127.8 | .0 | .0 | 37.0 | 39.6 | 42.4 | 45.4 | 48.6 |
| Inventories, % | 9.67 | 7.99 | 55.43 | 0 | 0 | 14.62 | 14.62 | 14.62 | 14.62 | 14.62 |
| Accounts Payable | 9.8 | 3.4 | 4.5 | 5.8 | 4.5 | 6.7 | 7.1 | 7.6 | 8.2 | 8.7 |
| Accounts Payable, % | 5.15 | 1.34 | 1.95 | 2.78 | 1.91 | 2.63 | 2.63 | 2.63 | 2.63 | 2.63 |
| Capital Expenditure | -25.1 | -53.5 | -21.7 | -31.2 | -50.8 | -40.6 | -43.4 | -46.5 | -49.7 | -53.2 |
| Capital Expenditure, % | -13.19 | -21.06 | -9.41 | -14.94 | -21.46 | -16.01 | -16.01 | -16.01 | -16.01 | -16.01 |
| Tax Rate, % | 5.67 | 5.67 | 5.67 | 5.67 | 5.67 | 5.67 | 5.67 | 5.67 | 5.67 | 5.67 |
| EBITAT | 14.5 | 47.7 | -109.9 | 46.5 | 84.6 | 37.5 | 40.2 | 43.0 | 46.0 | 49.3 |
| Depreciation | ||||||||||
| Changes in Account Receivables | ||||||||||
| Changes in Inventories | ||||||||||
| Changes in Accounts Payable | ||||||||||
| Capital Expenditure | ||||||||||
| UFCF | -34.4 | 69.4 | -199.2 | 166.1 | 76.6 | -5.4 | 39.8 | 42.6 | 45.5 | 48.7 |
| WACC, % | 6.51 | 6.78 | 6.05 | 7.19 | 7.52 | 6.81 | 6.81 | 6.81 | 6.81 | 6.81 |
| PV UFCF | ||||||||||
| SUM PV UFCF | 134.8 | |||||||||
| Long Term Growth Rate, % | 4.00 | |||||||||
| Free cash flow (T + 1) | 51 | |||||||||
| Terminal Value | 1,805 | |||||||||
| Present Terminal Value | 1,299 | |||||||||
| Enterprise Value | 1,433 | |||||||||
| Net Debt | 441 | |||||||||
| Equity Value | 992 | |||||||||
| Diluted Shares Outstanding, MM | 73 | |||||||||
| Equity Value Per Share | 13.64 |
What You Will Get
- Real Alexander & Baldwin Data: Preloaded financials – from revenue to EBIT – based on actual and projected figures.
- Full Customization: Adjust all critical parameters (yellow cells) like WACC, growth %, and tax rates.
- Instant Valuation Updates: Automatic recalculations to analyze the impact of changes on Alexander & Baldwin’s fair value.
- Versatile Excel Template: Tailored for quick edits, scenario testing, and detailed projections.
- Time-Saving and Accurate: Skip building models from scratch while maintaining precision and flexibility.
Key Features
- Accurate A&B Financials: Gain access to reliable pre-loaded historical data and future forecasts for Alexander & Baldwin, Inc. (ALEX).
- Adjustable Forecast Parameters: Modify highlighted cells for metrics such as WACC, growth rates, and profit margins.
- Real-Time Calculations: Automatic updates for DCF, Net Present Value (NPV), and cash flow assessments.
- User-Friendly Dashboard: Intuitive charts and summaries to help visualize your valuation outcomes.
- Designed for All Levels: A straightforward, accessible layout tailored for investors, CFOs, and consultants alike.
How It Works
- Step 1: Download the prebuilt Excel template featuring Alexander & Baldwin, Inc. (ALEX) data.
- Step 2: Navigate through the pre-filled sheets to familiarize yourself with the essential metrics.
- Step 3: Modify forecasts and assumptions in the editable yellow cells (WACC, growth, margins).
- Step 4: Instantly access recalibrated results, including the intrinsic value of Alexander & Baldwin, Inc. (ALEX).
- Step 5: Use the outputs to make well-informed investment decisions or create detailed reports.
Why Choose This Calculator for Alexander & Baldwin, Inc. (ALEX)?
- User-Friendly Interface: Perfect for both novices and seasoned professionals.
- Customizable Inputs: Adjust parameters to tailor your analysis of ALEX.
- Real-Time Valuation: Observe immediate updates to Alexander & Baldwin’s valuation with input changes.
- Pre-Loaded Data: Comes equipped with Alexander & Baldwin’s latest financial information for swift assessments.
- Relied Upon by Experts: A go-to tool for investors and analysts seeking to make well-informed choices.
Who Should Use This Product?
- Finance Students: Discover valuation methods and practice them with real-world data related to Alexander & Baldwin, Inc. (ALEX).
- Academics: Integrate industry-standard models into your research or educational programs focusing on ALEX.
- Investors: Validate your investment hypotheses and evaluate valuation results for Alexander & Baldwin, Inc. (ALEX).
- Analysts: Enhance your efficiency with a ready-to-use, customizable DCF model tailored for ALEX.
- Small Business Owners: Understand how major public entities like Alexander & Baldwin, Inc. (ALEX) are assessed in the market.
What the Template Contains
- Pre-Filled Data: Includes Alexander & Baldwin, Inc.'s historical financials and forecasts.
- Discounted Cash Flow Model: Editable DCF valuation model with automatic calculations.
- Weighted Average Cost of Capital (WACC): A dedicated sheet for calculating WACC based on custom inputs.
- Key Financial Ratios: Analyze Alexander & Baldwin, Inc.'s profitability, efficiency, and leverage.
- Customizable Inputs: Edit revenue growth, margins, and tax rates with ease.
- Clear Dashboard: Charts and tables summarizing key valuation results.
Disclaimer
All information, articles, and product details provided on this website are for general informational and educational purposes only. We do not claim any ownership over, nor do we intend to infringe upon, any trademarks, copyrights, logos, brand names, or other intellectual property mentioned or depicted on this site. Such intellectual property remains the property of its respective owners, and any references here are made solely for identification or informational purposes, without implying any affiliation, endorsement, or partnership.
We make no representations or warranties, express or implied, regarding the accuracy, completeness, or suitability of any content or products presented. Nothing on this website should be construed as legal, tax, investment, financial, medical, or other professional advice. In addition, no part of this site—including articles or product references—constitutes a solicitation, recommendation, endorsement, advertisement, or offer to buy or sell any securities, franchises, or other financial instruments, particularly in jurisdictions where such activity would be unlawful.
All content is of a general nature and may not address the specific circumstances of any individual or entity. It is not a substitute for professional advice or services. Any actions you take based on the information provided here are strictly at your own risk. You accept full responsibility for any decisions or outcomes arising from your use of this website and agree to release us from any liability in connection with your use of, or reliance upon, the content or products found herein.