
|
تقييم Allstate Corporation (All) DCF |
Fully Editable: Tailor To Your Needs In Excel Or Sheets
Professional Design: Trusted, Industry-Standard Templates
Investor-Approved Valuation Models
MAC/PC Compatible, Fully Unlocked
No Expertise Is Needed; Easy To Follow
The Allstate Corporation (ALL) Bundle
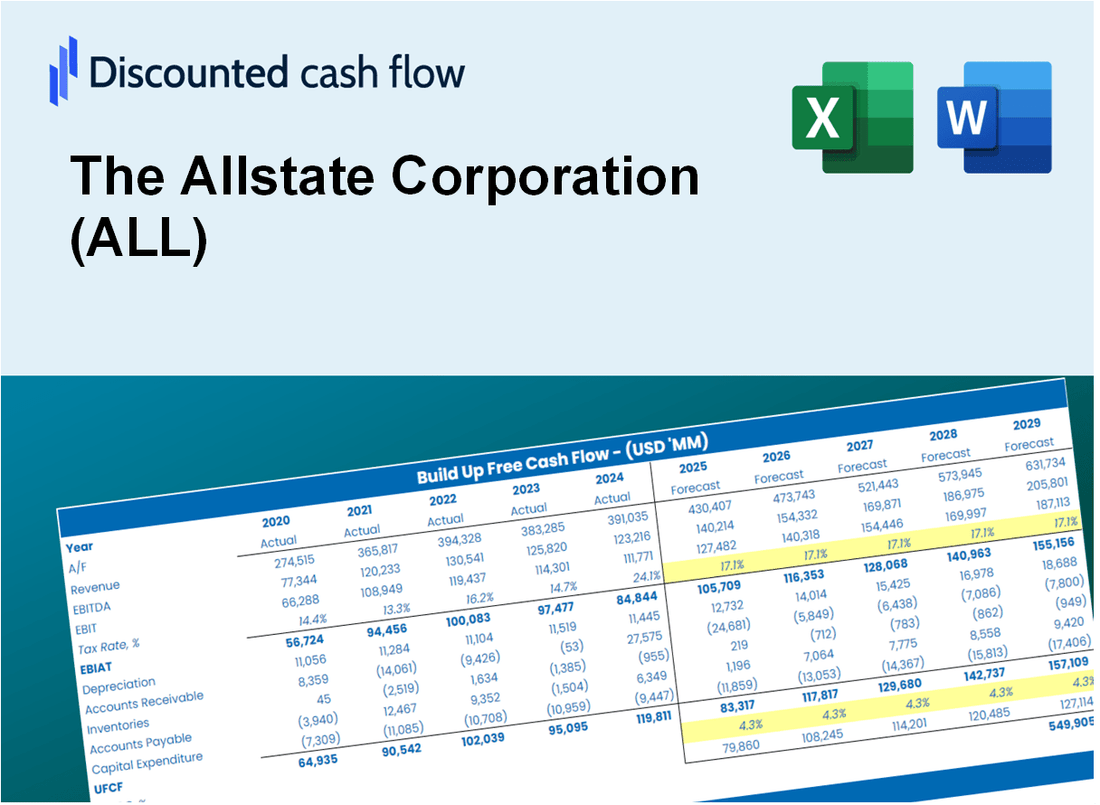
كمستثمر أو محلل، فإن حاسبة DCF (ALL) هذه هي أداتك الأساسية للتقييم الدقيق. تعرض بيانات حقيقية من The Allstate Corporation، يمكنك ضبط التوقعات ومراقبة التأثيرات في الوقت الفعلي.
What You Will Get
- Editable Forecast Inputs: Effortlessly adjust assumptions (growth %, margins, WACC) to explore various scenarios.
- Real-World Data: Allstate Corporation’s financial data pre-filled to facilitate your analysis.
- Automatic DCF Outputs: The template computes Net Present Value (NPV) and intrinsic value automatically.
- Customizable and Professional: A refined Excel model tailored to meet your valuation requirements.
- Built for Analysts and Investors: Perfect for evaluating projections, confirming strategies, and enhancing efficiency.
Key Features
- Customizable Risk Parameters: Adjust essential inputs such as premium growth, underwriting margins, and claims ratios.
- Instant Policy Valuation: Computes intrinsic value, present value of future cash flows, and additional metrics in real-time.
- Industry-Leading Precision: Leverages Allstate’s actual financial data for accurate valuation results.
- Effortless Scenario Planning: Evaluate various assumptions and analyze results with ease.
- Efficiency Booster: Remove the complexity of creating intricate valuation models from the ground up.
How It Works
- Step 1: Download the prebuilt Excel template featuring The Allstate Corporation’s (ALL) data.
- Step 2: Review the pre-filled sheets to familiarize yourself with the essential metrics.
- Step 3: Modify forecasts and assumptions in the editable yellow cells (WACC, growth, margins).
- Step 4: Instantly see the recalculated results, including The Allstate Corporation’s intrinsic value.
- Step 5: Make informed investment decisions or create reports based on the outputs.
Why Choose This Calculator for The Allstate Corporation (ALL)?
- Accuracy: Utilizes real Allstate financials to ensure precise data.
- Flexibility: Built for users to easily test and adjust inputs as needed.
- Time-Saving: Avoid the complexities of constructing a DCF model from the ground up.
- Professional-Grade: Crafted with the precision and usability expected at the CFO level.
- User-Friendly: Simple to navigate, even for individuals without extensive financial modeling knowledge.
Who Should Use This Product?
- Investors: Evaluate The Allstate Corporation’s (ALL) valuation before making stock transactions.
- CFOs and Financial Analysts: Optimize valuation methodologies and assess financial forecasts.
- Startup Founders: Understand how established companies like The Allstate Corporation are appraised.
- Consultants: Provide comprehensive valuation reports for clients involving The Allstate Corporation (ALL).
- Students and Educators: Utilize real-time data to learn and teach valuation strategies related to The Allstate Corporation (ALL).
What the Template Contains
- Pre-Filled DCF Model: The Allstate Corporation’s (ALL) financial data preloaded for immediate use.
- WACC Calculator: Detailed calculations for Weighted Average Cost of Capital.
- Financial Ratios: Evaluate The Allstate Corporation’s (ALL) profitability, leverage, and efficiency.
- Editable Inputs: Change assumptions such as growth, margins, and CAPEX to fit your scenarios.
- Financial Statements: Annual and quarterly reports to support detailed analysis.
- Interactive Dashboard: Easily visualize key valuation metrics and results.
Disclaimer
All information, articles, and product details provided on this website are for general informational and educational purposes only. We do not claim any ownership over, nor do we intend to infringe upon, any trademarks, copyrights, logos, brand names, or other intellectual property mentioned or depicted on this site. Such intellectual property remains the property of its respective owners, and any references here are made solely for identification or informational purposes, without implying any affiliation, endorsement, or partnership.
We make no representations or warranties, express or implied, regarding the accuracy, completeness, or suitability of any content or products presented. Nothing on this website should be construed as legal, tax, investment, financial, medical, or other professional advice. In addition, no part of this site—including articles or product references—constitutes a solicitation, recommendation, endorsement, advertisement, or offer to buy or sell any securities, franchises, or other financial instruments, particularly in jurisdictions where such activity would be unlawful.
All content is of a general nature and may not address the specific circumstances of any individual or entity. It is not a substitute for professional advice or services. Any actions you take based on the information provided here are strictly at your own risk. You accept full responsibility for any decisions or outcomes arising from your use of this website and agree to release us from any liability in connection with your use of, or reliance upon, the content or products found herein.