
|
Atlantic Union Bankshares Corporation (AUB) DCF تقييم |
Fully Editable: Tailor To Your Needs In Excel Or Sheets
Professional Design: Trusted, Industry-Standard Templates
Investor-Approved Valuation Models
MAC/PC Compatible, Fully Unlocked
No Expertise Is Needed; Easy To Follow
Atlantic Union Bankshares Corporation (AUB) Bundle
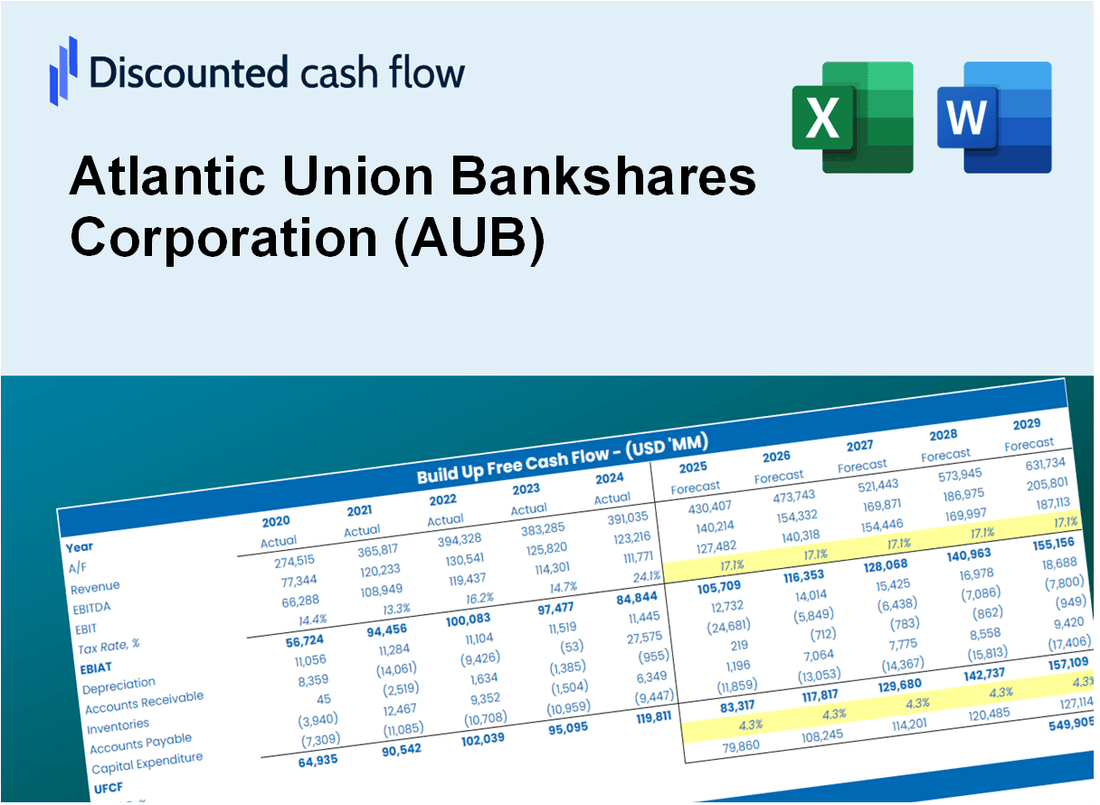
استكشف المستقبل المالي لشركة Atlantic Union Bankshares Corporation (AUB) مع حاسبة DCF سهلة الاستخدام! أدخل توقعاتك على النمو والهوامش والمصروفات لحساب القيمة الجوهرية لشركة Atlantic Union Bankshares Corporation (AUB) وتعزيز استراتيجية الاستثمار الخاصة بك.
Discounted Cash Flow (DCF) - (USD MM)
| Year | AY1 2020 |
AY2 2021 |
AY3 2022 |
AY4 2023 |
AY5 2024 |
FY1 2025 |
FY2 2026 |
FY3 2027 |
FY4 2028 |
FY5 2029 |
|---|---|---|---|---|---|---|---|---|---|---|
| Revenue | 784.9 | 711.2 | 779.0 | 1,045.3 | 1,346.4 | 1,558.9 | 1,805.0 | 2,089.8 | 2,419.7 | 2,801.6 |
| Revenue Growth, % | 0 | -9.4 | 9.53 | 34.2 | 28.8 | 15.78 | 15.78 | 15.78 | 15.78 | 15.78 |
| EBITDA | 229.4 | 369.5 | 325.4 | 280.9 | 295.1 | 535.5 | 620.0 | 717.8 | 831.1 | 962.3 |
| EBITDA, % | 29.23 | 51.96 | 41.77 | 26.87 | 21.92 | 34.35 | 34.35 | 34.35 | 34.35 | 34.35 |
| Depreciation | 43.1 | 50.7 | 45.4 | 41.0 | 35.3 | 77.9 | 90.2 | 104.5 | 121.0 | 140.1 |
| Depreciation, % | 5.49 | 7.13 | 5.83 | 3.92 | 2.62 | 5 | 5 | 5 | 5 | 5 |
| EBIT | 186.3 | 318.8 | 280.0 | 239.9 | 259.8 | 457.5 | 529.7 | 613.3 | 710.1 | 822.2 |
| EBIT, % | 23.73 | 44.82 | 35.94 | 22.95 | 19.3 | 29.35 | 29.35 | 29.35 | 29.35 | 29.35 |
| Total Cash | 3,031.7 | 4,281.3 | 3,060.3 | 2,595.6 | 2,792.3 | 1,558.9 | 1,805.0 | 2,089.8 | 2,419.7 | 2,801.6 |
| Total Cash, percent | .0 | .0 | .0 | .0 | .0 | .0 | .0 | .0 | .0 | .0 |
| Account Receivables | .0 | .0 | .0 | .0 | .0 | .0 | .0 | .0 | .0 | .0 |
| Account Receivables, % | 0 | 0 | 0 | 0 | 0 | 0 | 0 | 0 | 0 | 0 |
| Inventories | .0 | .0 | .0 | .0 | .0 | .0 | .0 | .0 | .0 | .0 |
| Inventories, % | 0 | 0 | 0 | 0 | 0 | 0 | 0 | 0 | 0 | 0 |
| Accounts Payable | .0 | .0 | .0 | .0 | .0 | .0 | .0 | .0 | .0 | .0 |
| Accounts Payable, % | 0 | 0 | 0 | 0 | 0 | 0 | 0 | 0 | 0 | 0 |
| Capital Expenditure | -29.6 | -9.4 | -2.9 | -5.1 | -7.4 | -20.2 | -23.4 | -27.1 | -31.4 | -36.4 |
| Capital Expenditure, % | -3.77 | -1.32 | -0.36652 | -0.48798 | -0.54909 | -1.3 | -1.3 | -1.3 | -1.3 | -1.3 |
| Tax Rate, % | 19.5 | 19.5 | 19.5 | 19.5 | 19.5 | 19.5 | 19.5 | 19.5 | 19.5 | 19.5 |
| EBITAT | 158.2 | 263.9 | 234.5 | 201.8 | 209.1 | 380.8 | 440.9 | 510.4 | 591.0 | 684.3 |
| Depreciation | ||||||||||
| Changes in Account Receivables | ||||||||||
| Changes in Inventories | ||||||||||
| Changes in Accounts Payable | ||||||||||
| Capital Expenditure | ||||||||||
| UFCF | 171.8 | 305.3 | 277.1 | 237.7 | 237.1 | 438.5 | 507.7 | 587.8 | 680.6 | 788.0 |
| WACC, % | 19.75 | 19.42 | 19.57 | 19.63 | 19.06 | 19.49 | 19.49 | 19.49 | 19.49 | 19.49 |
| PV UFCF | ||||||||||
| SUM PV UFCF | 1,724.5 | |||||||||
| Long Term Growth Rate, % | 2.00 | |||||||||
| Free cash flow (T + 1) | 804 | |||||||||
| Terminal Value | 4,596 | |||||||||
| Present Terminal Value | 1,887 | |||||||||
| Enterprise Value | 3,612 | |||||||||
| Net Debt | 184 | |||||||||
| Equity Value | 3,427 | |||||||||
| Diluted Shares Outstanding, MM | 88 | |||||||||
| Equity Value Per Share | 38.99 |
What You Will Get
- Real Atlantic Union Bankshares Data: Preloaded financials – from revenue to EBIT – based on actual and projected figures for Atlantic Union Bankshares Corporation (AUB).
- Full Customization: Adjust all critical parameters (yellow cells) like WACC, growth %, and tax rates to fit your analysis.
- Instant Valuation Updates: Automatic recalculations to assess the impact of changes on Atlantic Union Bankshares' fair value.
- Versatile Excel Template: Designed for quick edits, scenario testing, and detailed projections specific to Atlantic Union Bankshares Corporation (AUB).
- Time-Saving and Accurate: Eliminate the need to build models from scratch while ensuring precision and adaptability.
Key Features
- Accurate Financial Data: Access reliable pre-loaded historical figures and future forecasts for Atlantic Union Bankshares Corporation (AUB).
- Adjustable Forecast Inputs: Modify highlighted cells for key metrics like WACC, growth rates, and profit margins.
- Real-Time Calculations: Automatic updates for DCF, Net Present Value (NPV), and cash flow assessments.
- User-Friendly Dashboard: Clear charts and summaries to help you visualize your valuation outcomes.
- Designed for All Levels: An easy-to-navigate layout suitable for investors, CFOs, and consultants alike.
How It Works
- 1. Access the Template: Download and open the Excel file containing Atlantic Union Bankshares Corporation’s (AUB) financial data.
- 2. Modify Assumptions: Adjust key parameters such as growth rates, WACC, and capital expenditures.
- 3. View Results Live: The DCF model automatically computes intrinsic value and NPV based on your inputs.
- 4. Explore Scenarios: Evaluate various forecasts to understand different valuation possibilities.
- 5. Present with Assurance: Deliver professional valuation insights to enhance your decision-making process.
Why Choose This Calculator for Atlantic Union Bankshares Corporation (AUB)?
- Accuracy: Leveraging real AUB financials for precise data.
- Flexibility: Allows users to easily test and adjust inputs as needed.
- Time-Saving: Avoid the complexities of creating a DCF model from the ground up.
- Professional-Grade: Crafted with the expertise and usability expected at the CFO level.
- User-Friendly: Intuitive design makes it accessible for users without extensive financial modeling skills.
Who Should Use Atlantic Union Bankshares Corporation (AUB)?
- Investors: Gain insights for informed decision-making with a reliable banking partner.
- Financial Analysts: Streamline your analysis with comprehensive financial data and reports.
- Consultants: Easily tailor financial solutions for your clients using AUB's offerings.
- Finance Enthusiasts: Explore banking strategies and services to enhance your financial knowledge.
- Educators and Students: Utilize AUB as a case study for banking and finance education.
What the Template Contains for Atlantic Union Bankshares Corporation (AUB)
- Comprehensive DCF Model: Editable template with detailed valuation calculations tailored for AUB.
- Real-World Data: Atlantic Union Bankshares Corporation’s historical and projected financials preloaded for analysis.
- Customizable Parameters: Adjust WACC, growth rates, and tax assumptions to test various scenarios specific to AUB.
- Financial Statements: Full annual and quarterly breakdowns for deeper insights into AUB's performance.
- Key Ratios: Built-in analysis for profitability, efficiency, and leverage metrics relevant to AUB.
- Dashboard with Visual Outputs: Charts and tables designed for clear, actionable results regarding AUB's financial health.
Disclaimer
All information, articles, and product details provided on this website are for general informational and educational purposes only. We do not claim any ownership over, nor do we intend to infringe upon, any trademarks, copyrights, logos, brand names, or other intellectual property mentioned or depicted on this site. Such intellectual property remains the property of its respective owners, and any references here are made solely for identification or informational purposes, without implying any affiliation, endorsement, or partnership.
We make no representations or warranties, express or implied, regarding the accuracy, completeness, or suitability of any content or products presented. Nothing on this website should be construed as legal, tax, investment, financial, medical, or other professional advice. In addition, no part of this site—including articles or product references—constitutes a solicitation, recommendation, endorsement, advertisement, or offer to buy or sell any securities, franchises, or other financial instruments, particularly in jurisdictions where such activity would be unlawful.
All content is of a general nature and may not address the specific circumstances of any individual or entity. It is not a substitute for professional advice or services. Any actions you take based on the information provided here are strictly at your own risk. You accept full responsibility for any decisions or outcomes arising from your use of this website and agree to release us from any liability in connection with your use of, or reliance upon, the content or products found herein.