
|
Baidu ، Inc. (BIDU) DCF تقييم |
Fully Editable: Tailor To Your Needs In Excel Or Sheets
Professional Design: Trusted, Industry-Standard Templates
Investor-Approved Valuation Models
MAC/PC Compatible, Fully Unlocked
No Expertise Is Needed; Easy To Follow
Baidu, Inc. (BIDU) Bundle
سواء كنت مستثمرًا أو محللًا ، فإن حاسبة DCF (BIDU) هذه هي أداةك الأساسية للتقييم الدقيق. محملة بالبيانات الحقيقية من Baidu ، Inc. ، يمكنك ضبط التوقعات ومراقبة التأثيرات في الوقت الفعلي.
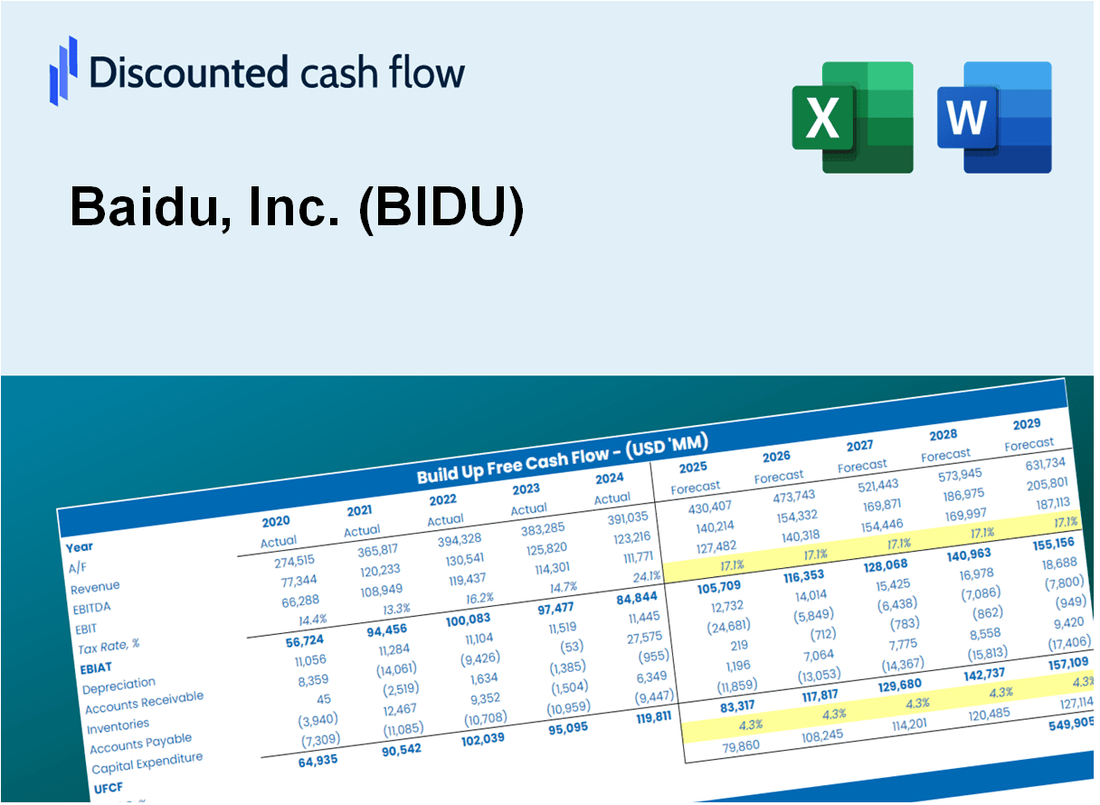
Discounted Cash Flow (DCF) - (USD MM)
| Year | AY1 2020 |
AY2 2021 |
AY3 2022 |
AY4 2023 |
AY5 2024 |
FY1 2025 |
FY2 2026 |
FY3 2027 |
FY4 2028 |
FY5 2029 |
|---|---|---|---|---|---|---|---|---|---|---|
| Revenue | 15,094.2 | 17,549.8 | 17,434.5 | 18,974.3 | 18,766.7 | 19,862.1 | 21,021.5 | 22,248.6 | 23,547.2 | 24,921.7 |
| Revenue Growth, % | 0 | 16.27 | -0.65707 | 8.83 | -1.09 | 5.84 | 5.84 | 5.84 | 5.84 | 5.84 |
| EBITDA | 4,633.7 | 3,822.7 | 4,328.3 | 5,150.3 | 5,067.7 | 5,221.9 | 5,526.7 | 5,849.3 | 6,190.8 | 6,552.1 |
| EBITDA, % | 30.7 | 21.78 | 24.83 | 27.14 | 27 | 26.29 | 26.29 | 26.29 | 26.29 | 26.29 |
| Depreciation | 2,562.8 | 2,317.3 | 2,075.8 | 2,069.3 | 2,069.3 | 2,543.2 | 2,691.6 | 2,848.8 | 3,015.1 | 3,191.0 |
| Depreciation, % | 16.98 | 13.2 | 11.91 | 10.91 | 11.03 | 12.8 | 12.8 | 12.8 | 12.8 | 12.8 |
| EBIT | 2,070.9 | 1,505.4 | 2,252.6 | 3,081.0 | 2,998.4 | 2,678.7 | 2,835.1 | 3,000.6 | 3,175.7 | 3,361.1 |
| EBIT, % | 13.72 | 8.58 | 12.92 | 16.24 | 15.98 | 13.49 | 13.49 | 13.49 | 13.49 | 13.49 |
| Total Cash | 22,863.1 | 25,387.7 | 24,528.1 | 27,334.3 | 17,965.2 | 19,692.5 | 20,841.9 | 22,058.5 | 23,346.1 | 24,708.9 |
| Total Cash, percent | .0 | .0 | .0 | .0 | .0 | .0 | .0 | .0 | .0 | .0 |
| Account Receivables | 1,633.7 | 2,090.4 | 2,979.4 | 2,342.9 | 2,013.1 | 2,498.6 | 2,644.4 | 2,798.8 | 2,962.2 | 3,135.1 |
| Account Receivables, % | 10.82 | 11.91 | 17.09 | 12.35 | 10.73 | 12.58 | 12.58 | 12.58 | 12.58 | 12.58 |
| Inventories | 87.1 | 208.2 | 173.0 | 196.8 | 844.3 | 329.4 | 348.6 | 369.0 | 390.5 | 413.3 |
| Inventories, % | 0.57717 | 1.19 | 0.99212 | 1.04 | 4.5 | 1.66 | 1.66 | 1.66 | 1.66 | 1.66 |
| Accounts Payable | 442.8 | .0 | .0 | .0 | .0 | 116.5 | 123.3 | 130.5 | 138.2 | 146.2 |
| Accounts Payable, % | 2.93 | 0 | 0 | 0 | 0 | 0.5867 | 0.5867 | 0.5867 | 0.5867 | 0.5867 |
| Capital Expenditure | -751.5 | -1,584.5 | -1,183.2 | -1,592.3 | -1,146.7 | -1,402.1 | -1,483.9 | -1,570.5 | -1,662.2 | -1,759.2 |
| Capital Expenditure, % | -4.98 | -9.03 | -6.79 | -8.39 | -6.11 | -7.06 | -7.06 | -7.06 | -7.06 | -7.06 |
| Tax Rate, % | 16.99 | 16.99 | 16.99 | 16.99 | 16.99 | 16.99 | 16.99 | 16.99 | 16.99 | 16.99 |
| EBITAT | 2,015.4 | 1,428.3 | 1,683.9 | 2,484.0 | 2,489.1 | 2,306.9 | 2,441.5 | 2,584.0 | 2,734.9 | 2,894.5 |
| Depreciation | ||||||||||
| Changes in Account Receivables | ||||||||||
| Changes in Inventories | ||||||||||
| Changes in Accounts Payable | ||||||||||
| Capital Expenditure | ||||||||||
| UFCF | 2,548.7 | 1,140.5 | 1,722.8 | 3,573.7 | 3,094.1 | 3,593.9 | 3,491.0 | 3,694.7 | 3,910.4 | 4,138.7 |
| WACC, % | 4.3 | 4.24 | 3.72 | 3.87 | 3.93 | 4.01 | 4.01 | 4.01 | 4.01 | 4.01 |
| PV UFCF | ||||||||||
| SUM PV UFCF | 16,706.5 | |||||||||
| Long Term Growth Rate, % | 4.00 | |||||||||
| Free cash flow (T + 1) | 4,304 | |||||||||
| Terminal Value | 36,952,728 | |||||||||
| Present Terminal Value | 30,355,446 | |||||||||
| Enterprise Value | 30,372,153 | |||||||||
| Net Debt | 7,682 | |||||||||
| Equity Value | 30,364,471 | |||||||||
| Diluted Shares Outstanding, MM | 44 | |||||||||
| Equity Value Per Share | 694,541.15 |
What You Will Get
- Real BIDU Financial Data: Pre-filled with Baidu’s historical and projected data for precise analysis.
- Fully Editable Template: Modify key inputs like revenue growth, WACC, and EBITDA % with ease.
- Automatic Calculations: See Baidu’s intrinsic value update instantly based on your changes.
- Professional Valuation Tool: Designed for investors, analysts, and consultants seeking accurate DCF results.
- User-Friendly Design: Simple structure and clear instructions for all experience levels.
Key Features
- Customizable Forecast Inputs: Adjust essential parameters such as revenue growth, EBITDA margin, and capital expenditures.
- Instant DCF Valuation: Automatically computes intrinsic value, NPV, and additional financial metrics.
- High-Precision Accuracy: Leverages Baidu's actual financial data for credible valuation results.
- Effortless Scenario Analysis: Evaluate various assumptions and easily compare different outcomes.
- Efficiency Booster: Avoid the complexities of creating intricate valuation models from the ground up.
How It Works
- Download: Get the pre-prepared Excel file containing Baidu, Inc.'s (BIDU) financial data.
- Customize: Modify forecasts such as revenue growth, EBITDA %, and WACC to fit your analysis.
- Update Automatically: Watch as intrinsic value and NPV calculations refresh in real-time.
- Test Scenarios: Develop various projections and instantly compare the results.
- Make Decisions: Leverage the valuation findings to inform your investment approach.
Why Choose This Calculator for Baidu, Inc. (BIDU)?
- Accuracy: Utilizes real Baidu financials to ensure precise data.
- Flexibility: Built for users to easily test and modify their inputs.
- Time-Saving: Avoid the complexities of creating a DCF model from the ground up.
- Professional-Grade: Crafted with the precision and usability expected by CFOs.
- User-Friendly: Intuitive design makes it accessible for those without extensive financial modeling expertise.
Who Should Use This Product?
- Investors: Accurately estimate Baidu, Inc.'s (BIDU) fair value before making investment decisions.
- CFOs: Utilize a professional-grade DCF model for financial reporting and analysis related to Baidu, Inc. (BIDU).
- Consultants: Quickly tailor the template for valuation reports focused on Baidu, Inc. (BIDU) for clients.
- Entrepreneurs: Gain insights into financial modeling practices employed by leading tech companies like Baidu, Inc. (BIDU).
- Educators: Use it as a teaching tool to illustrate valuation methodologies applicable to Baidu, Inc. (BIDU).
What the Template Contains
- Pre-Filled Data: Includes Baidu's historical financials and projections.
- Discounted Cash Flow Model: Editable DCF valuation model with automated calculations.
- Weighted Average Cost of Capital (WACC): A dedicated sheet for calculating WACC based on user-defined inputs.
- Key Financial Ratios: Evaluate Baidu's profitability, efficiency, and leverage.
- Customizable Inputs: Easily modify revenue growth, profit margins, and tax rates.
- Clear Dashboard: Visual representations and tables summarizing essential valuation outcomes.
Disclaimer
All information, articles, and product details provided on this website are for general informational and educational purposes only. We do not claim any ownership over, nor do we intend to infringe upon, any trademarks, copyrights, logos, brand names, or other intellectual property mentioned or depicted on this site. Such intellectual property remains the property of its respective owners, and any references here are made solely for identification or informational purposes, without implying any affiliation, endorsement, or partnership.
We make no representations or warranties, express or implied, regarding the accuracy, completeness, or suitability of any content or products presented. Nothing on this website should be construed as legal, tax, investment, financial, medical, or other professional advice. In addition, no part of this site—including articles or product references—constitutes a solicitation, recommendation, endorsement, advertisement, or offer to buy or sell any securities, franchises, or other financial instruments, particularly in jurisdictions where such activity would be unlawful.
All content is of a general nature and may not address the specific circumstances of any individual or entity. It is not a substitute for professional advice or services. Any actions you take based on the information provided here are strictly at your own risk. You accept full responsibility for any decisions or outcomes arising from your use of this website and agree to release us from any liability in connection with your use of, or reliance upon, the content or products found herein.