
|
Blackbaud ، Inc. (BLKB) تقييم DCF |
Fully Editable: Tailor To Your Needs In Excel Or Sheets
Professional Design: Trusted, Industry-Standard Templates
Investor-Approved Valuation Models
MAC/PC Compatible, Fully Unlocked
No Expertise Is Needed; Easy To Follow
Blackbaud, Inc. (BLKB) Bundle
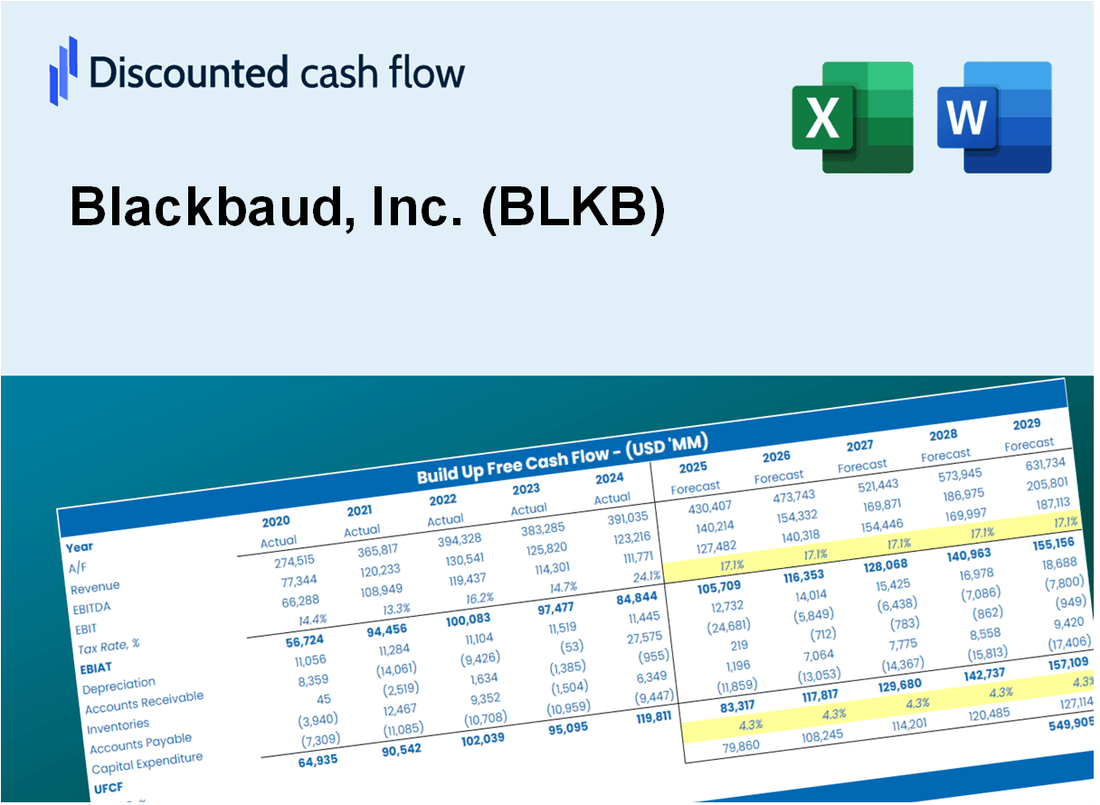
تعزيز تحليل التقييم الخاص بك لـ Blackbaud ، Inc. (BLKB) مع حاسبة DCF المتطورة لدينا! يأتي قالب Excel هذا مسبقًا مع بيانات حقيقية (BLKB) ، مما يتيح لك ضبط التوقعات والافتراضات لحساب دقيق للقيمة الجوهرية لـ Blackbaud.
Discounted Cash Flow (DCF) - (USD MM)
| Year | AY1 2020 |
AY2 2021 |
AY3 2022 |
AY4 2023 |
AY5 2024 |
FY1 2025 |
FY2 2026 |
FY3 2027 |
FY4 2028 |
FY5 2029 |
|---|---|---|---|---|---|---|---|---|---|---|
| Revenue | 913.2 | 927.7 | 1,058.1 | 1,105.4 | 1,155.5 | 1,226.7 | 1,302.3 | 1,382.5 | 1,467.7 | 1,558.1 |
| Revenue Growth, % | 0 | 1.59 | 14.05 | 4.47 | 4.53 | 6.16 | 6.16 | 6.16 | 6.16 | 6.16 |
| EBITDA | 103.9 | 83.7 | 99.0 | 178.7 | 253.7 | 166.5 | 176.8 | 187.7 | 199.2 | 211.5 |
| EBITDA, % | 11.38 | 9.02 | 9.36 | 16.17 | 21.96 | 13.58 | 13.58 | 13.58 | 13.58 | 13.58 |
| Depreciation | 61.0 | 51.4 | 65.6 | 66.7 | 73.4 | 75.6 | 80.2 | 85.2 | 90.4 | 96.0 |
| Depreciation, % | 6.68 | 5.54 | 6.2 | 6.03 | 6.35 | 6.16 | 6.16 | 6.16 | 6.16 | 6.16 |
| EBIT | 42.8 | 32.3 | 33.4 | 112.0 | 180.4 | 91.0 | 96.6 | 102.5 | 108.8 | 115.5 |
| EBIT, % | 4.69 | 3.48 | 3.16 | 10.13 | 15.61 | 7.41 | 7.41 | 7.41 | 7.41 | 7.41 |
| Total Cash | 35.8 | 55.1 | 31.7 | 31.3 | 67.6 | 52.8 | 56.1 | 59.5 | 63.2 | 67.1 |
| Total Cash, percent | .0 | .0 | .0 | .0 | .0 | .0 | .0 | .0 | .0 | .0 |
| Account Receivables | 95.7 | 103.7 | 103.1 | 102.2 | 83.5 | 117.5 | 124.7 | 132.4 | 140.5 | 149.2 |
| Account Receivables, % | 10.48 | 11.18 | 9.74 | 9.25 | 7.23 | 9.58 | 9.58 | 9.58 | 9.58 | 9.58 |
| Inventories | .0 | .0 | .0 | .0 | .0 | .0 | .0 | .0 | .0 | .0 |
| Inventories, % | 0 | 0 | 0 | 0 | 0 | 0 | 0 | 0 | 0 | 0 |
| Accounts Payable | 27.8 | 22.1 | 42.6 | 25.2 | 50.8 | 39.6 | 42.0 | 44.6 | 47.3 | 50.2 |
| Accounts Payable, % | 3.05 | 2.38 | 4.02 | 2.28 | 4.4 | 3.22 | 3.22 | 3.22 | 3.22 | 3.22 |
| Capital Expenditure | -71.8 | -52.2 | -71.1 | -4.7 | -7.4 | -52.2 | -55.4 | -58.8 | -62.4 | -66.3 |
| Capital Expenditure, % | -7.87 | -5.62 | -6.72 | -0.42382 | -0.64414 | -4.25 | -4.25 | -4.25 | -4.25 | -4.25 |
| Tax Rate, % | 9.12 | 9.12 | 9.12 | 9.12 | 9.12 | 9.12 | 9.12 | 9.12 | 9.12 | 9.12 |
| EBITAT | 15.3 | 26.0 | 27.3 | 11.6 | 163.9 | 54.4 | 57.8 | 61.3 | 65.1 | 69.1 |
| Depreciation | ||||||||||
| Changes in Account Receivables | ||||||||||
| Changes in Inventories | ||||||||||
| Changes in Accounts Payable | ||||||||||
| Capital Expenditure | ||||||||||
| UFCF | -63.4 | 11.5 | 43.0 | 57.0 | 274.1 | 32.6 | 77.8 | 82.6 | 87.7 | 93.1 |
| WACC, % | 6.97 | 7.56 | 7.57 | 6.63 | 7.7 | 7.28 | 7.28 | 7.28 | 7.28 | 7.28 |
| PV UFCF | ||||||||||
| SUM PV UFCF | 296.5 | |||||||||
| Long Term Growth Rate, % | 4.00 | |||||||||
| Free cash flow (T + 1) | 97 | |||||||||
| Terminal Value | 2,946 | |||||||||
| Present Terminal Value | 2,073 | |||||||||
| Enterprise Value | 2,369 | |||||||||
| Net Debt | 1,042 | |||||||||
| Equity Value | 1,328 | |||||||||
| Diluted Shares Outstanding, MM | 51 | |||||||||
| Equity Value Per Share | 26.26 |
What You Will Get
- Pre-Filled Financial Model: Blackbaud’s actual data enables precise DCF valuation.
- Full Forecast Control: Adjust revenue growth, margins, WACC, and other key drivers.
- Instant Calculations: Automatic updates ensure you see results as you make changes.
- Investor-Ready Template: A refined Excel file designed for professional-grade valuation.
- Customizable and Reusable: Tailored for flexibility, allowing repeated use for detailed forecasts.
Key Features
- Comprehensive DCF Calculator: Features robust unlevered and levered DCF valuation models tailored for Blackbaud, Inc. (BLKB).
- WACC Calculator: Ready-to-use Weighted Average Cost of Capital sheet with adjustable parameters specific to Blackbaud, Inc. (BLKB).
- Customizable Forecast Assumptions: Easily alter growth rates, capital expenditures, and discount rates to fit Blackbaud, Inc. (BLKB) projections.
- Integrated Financial Ratios: Evaluate profitability, leverage, and efficiency ratios relevant to Blackbaud, Inc. (BLKB).
- Interactive Dashboard and Charts: Visual representations provide a summary of essential valuation metrics for straightforward analysis.
How It Works
- Step 1: Download the Excel file.
- Step 2: Review pre-entered Blackbaud data (historical and projected).
- Step 3: Adjust key assumptions (yellow cells) based on your analysis.
- Step 4: View automatic recalculations for Blackbaud’s intrinsic value.
- Step 5: Use the outputs for investment decisions or reporting.
Why Choose Blackbaud's Solutions?
- Streamline Processes: Eliminate the hassle of manual data entry with our automated tools.
- Enhance Accuracy: Our advanced analytics ensure reliable insights for better decision-making.
- Fully Customizable: Adapt our solutions to meet your organization's specific needs and goals.
- User-Friendly Interface: Intuitive design allows for easy navigation and quick understanding of results.
- Endorsed by Industry Leaders: Trusted by nonprofits and organizations that prioritize effectiveness and efficiency.
Who Should Use This Product?
- Individual Investors: Gain insights for making informed decisions on investing in Blackbaud, Inc. (BLKB).
- Financial Analysts: Enhance valuation analyses with comprehensive financial models tailored for Blackbaud, Inc. (BLKB).
- Consultants: Provide clients with accurate and timely valuation assessments for Blackbaud, Inc. (BLKB).
- Business Owners: Learn how companies like Blackbaud, Inc. (BLKB) are valued to inform your own business strategies.
- Finance Students: Explore real-world valuation techniques using data from Blackbaud, Inc. (BLKB).
What the Template Contains
- Historical Data: Includes Blackbaud’s past financials and baseline forecasts.
- DCF and Levered DCF Models: Detailed templates to calculate Blackbaud’s intrinsic value.
- WACC Sheet: Pre-built calculations for Weighted Average Cost of Capital.
- Editable Inputs: Modify key drivers like growth rates, EBITDA %, and CAPEX assumptions.
- Quarterly and Annual Statements: A complete breakdown of Blackbaud’s financials.
- Interactive Dashboard: Visualize valuation results and projections dynamically.
Disclaimer
All information, articles, and product details provided on this website are for general informational and educational purposes only. We do not claim any ownership over, nor do we intend to infringe upon, any trademarks, copyrights, logos, brand names, or other intellectual property mentioned or depicted on this site. Such intellectual property remains the property of its respective owners, and any references here are made solely for identification or informational purposes, without implying any affiliation, endorsement, or partnership.
We make no representations or warranties, express or implied, regarding the accuracy, completeness, or suitability of any content or products presented. Nothing on this website should be construed as legal, tax, investment, financial, medical, or other professional advice. In addition, no part of this site—including articles or product references—constitutes a solicitation, recommendation, endorsement, advertisement, or offer to buy or sell any securities, franchises, or other financial instruments, particularly in jurisdictions where such activity would be unlawful.
All content is of a general nature and may not address the specific circumstances of any individual or entity. It is not a substitute for professional advice or services. Any actions you take based on the information provided here are strictly at your own risk. You accept full responsibility for any decisions or outcomes arising from your use of this website and agree to release us from any liability in connection with your use of, or reliance upon, the content or products found herein.