
|
شركة CONSOL Energy Inc. (CEIX) تقييم DCF |
Fully Editable: Tailor To Your Needs In Excel Or Sheets
Professional Design: Trusted, Industry-Standard Templates
Investor-Approved Valuation Models
MAC/PC Compatible, Fully Unlocked
No Expertise Is Needed; Easy To Follow
CONSOL Energy Inc. (CEIX) Bundle
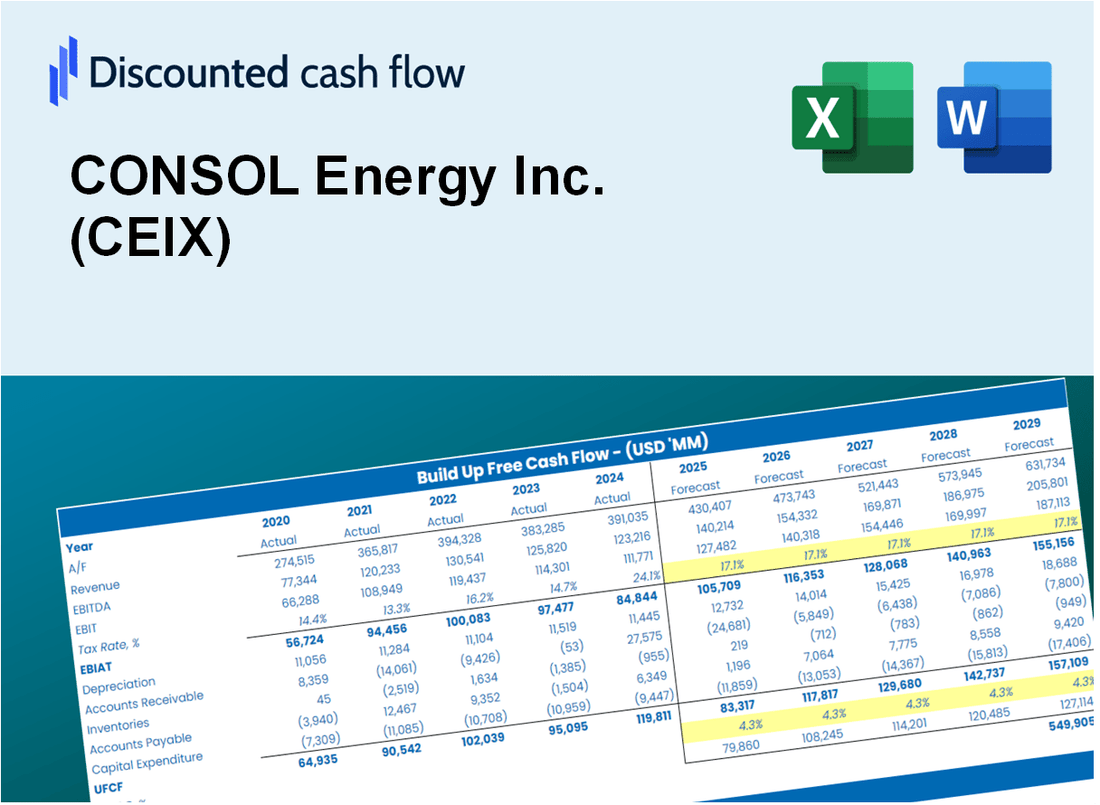
تبسيط تحليلك وتحسين الدقة مع حاسبة (CEIX) DCF لدينا! باستخدام البيانات الفعلية من Consol Energy Inc. والافتراضات القابلة للتخصيص ، تمكنك هذه الأداة من التنبؤ والتقييم والتقييم (CEIX) مثل المستثمر المحنك.
What You Will Receive
- Pre-Filled Financial Model: CONSOL Energy Inc.’s actual data allows for accurate DCF valuation.
- Comprehensive Forecast Control: Modify revenue growth, margins, WACC, and other essential factors.
- Real-Time Calculations: Automatic updates provide immediate feedback as you adjust inputs.
- Investor-Ready Template: A polished Excel file crafted for high-quality valuation.
- Customizable and Reusable: Designed for adaptability, enabling repeated application for in-depth forecasts.
Key Features
- Real-Life CEIX Data: Pre-filled with CONSOL Energy’s historical financials and future projections.
- Fully Customizable Inputs: Modify revenue growth, profit margins, WACC, tax rates, and capital expenditures.
- Dynamic Valuation Model: Automatically refreshes Net Present Value (NPV) and intrinsic value based on your adjustments.
- Scenario Testing: Develop various forecast scenarios to evaluate different valuation results.
- User-Friendly Design: Intuitive, organized, and suitable for both professionals and newcomers.
How It Works
- Download: Obtain the pre-prepared Excel file containing CONSOL Energy Inc.'s (CEIX) financial data.
- Customize: Modify projections, such as revenue growth, EBITDA %, and WACC.
- Update Automatically: The intrinsic value and NPV calculations refresh in real-time.
- Test Scenarios: Generate various projections and evaluate outcomes immediately.
- Make Decisions: Leverage the valuation results to inform your investment strategy.
Why Choose This Calculator for CONSOL Energy Inc. (CEIX)?
- All-in-One Solution: Integrates DCF, WACC, and financial ratio analyses tailored for CONSOL Energy Inc. (CEIX).
- Flexible Inputs: Modify yellow-highlighted cells to explore different financial scenarios for CONSOL Energy Inc. (CEIX).
- In-Depth Analysis: Automatically computes the intrinsic value and Net Present Value for CONSOL Energy Inc. (CEIX).
- Preloaded Information: Historical and projected data provide reliable starting points for analysis.
- Expert-Level Tool: Perfect for financial analysts, investors, and business advisors focusing on CONSOL Energy Inc. (CEIX).
Who Should Use This Product?
- Investors: Assess CONSOL Energy Inc. (CEIX) valuation before making investment decisions.
- CFOs and Financial Analysts: Optimize valuation methodologies and evaluate financial forecasts.
- Startup Founders: Understand the valuation process of established energy companies like CONSOL Energy Inc. (CEIX).
- Consultants: Provide comprehensive valuation analyses for clients in the energy sector.
- Students and Educators: Utilize real data to learn and teach valuation strategies in finance.
What the Template Contains
- Pre-Filled Data: Contains CONSOL Energy Inc.'s historical financials and projections.
- Discounted Cash Flow Model: Editable DCF valuation model with automatic calculations.
- Weighted Average Cost of Capital (WACC): A dedicated sheet for calculating WACC based on custom inputs.
- Key Financial Ratios: Evaluate CONSOL Energy Inc.'s profitability, efficiency, and leverage.
- Customizable Inputs: Easily modify revenue growth, margins, and tax rates.
- Clear Dashboard: Visualizations and tables summarizing essential valuation results.
Disclaimer
All information, articles, and product details provided on this website are for general informational and educational purposes only. We do not claim any ownership over, nor do we intend to infringe upon, any trademarks, copyrights, logos, brand names, or other intellectual property mentioned or depicted on this site. Such intellectual property remains the property of its respective owners, and any references here are made solely for identification or informational purposes, without implying any affiliation, endorsement, or partnership.
We make no representations or warranties, express or implied, regarding the accuracy, completeness, or suitability of any content or products presented. Nothing on this website should be construed as legal, tax, investment, financial, medical, or other professional advice. In addition, no part of this site—including articles or product references—constitutes a solicitation, recommendation, endorsement, advertisement, or offer to buy or sell any securities, franchises, or other financial instruments, particularly in jurisdictions where such activity would be unlawful.
All content is of a general nature and may not address the specific circumstances of any individual or entity. It is not a substitute for professional advice or services. Any actions you take based on the information provided here are strictly at your own risk. You accept full responsibility for any decisions or outcomes arising from your use of this website and agree to release us from any liability in connection with your use of, or reliance upon, the content or products found herein.