
|
Cleveland-Cliffs Inc. (CLF) تقييم DCF |
Fully Editable: Tailor To Your Needs In Excel Or Sheets
Professional Design: Trusted, Industry-Standard Templates
Investor-Approved Valuation Models
MAC/PC Compatible, Fully Unlocked
No Expertise Is Needed; Easy To Follow
Cleveland-Cliffs Inc. (CLF) Bundle
قم بتحسين وقتك وتحسين الدقة من خلال حاسبة DCF (CLF)! باستخدام بيانات Real Cleveland-Cliffs Inc. وافتراضات قابلة للتخصيص ، تمكنك هذه الأداة من التنبؤ وتحليل وتقييم (CLF) تمامًا مثل المستثمر المخضرم.
What You Will Get
- Editable Excel Template: A fully customizable Excel-based DCF Calculator featuring pre-filled real CLF financials.
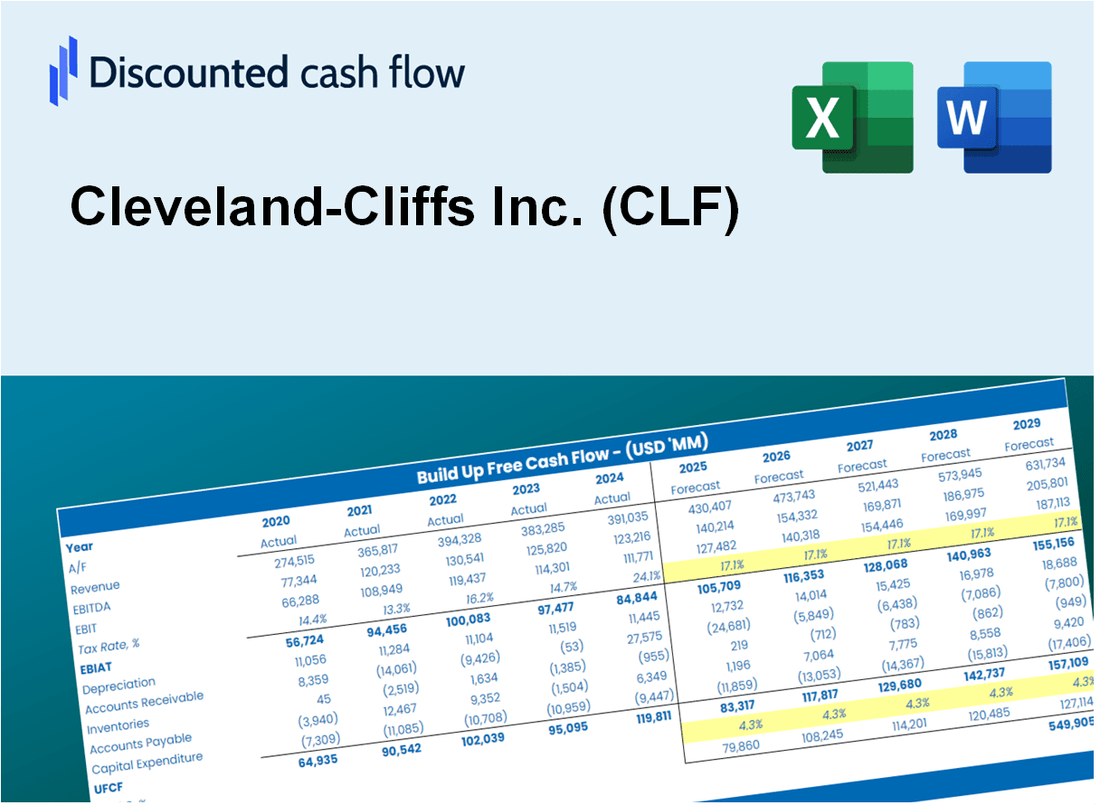
- Real-World Data: Historical data and forward-looking estimates (as indicated in the yellow cells).
- Forecast Flexibility: Adjust forecast assumptions such as revenue growth, EBITDA %, and WACC.
- Automatic Calculations: Instantly observe the effect of your inputs on Cleveland-Cliffs Inc.’s valuation.
- Professional Tool: Designed for investors, CFOs, consultants, and financial analysts.
- User-Friendly Design: Organized for clarity and ease of use, complete with step-by-step instructions.
Key Features
- Accurate Cleveland-Cliffs Financials: Access reliable pre-loaded historical data and future forecasts.
- Customizable Forecast Parameters: Modify yellow-highlighted fields such as WACC, growth rates, and profit margins.
- Real-Time Calculations: Automatic updates for DCF, Net Present Value (NPV), and cash flow assessments.
- User-Friendly Dashboard: Intuitive charts and summaries to easily visualize your valuation outcomes.
- Designed for All Users: A straightforward, intuitive layout tailored for investors, CFOs, and consultants.
How It Works
- Step 1: Download the prebuilt Excel template with Cleveland-Cliffs Inc. (CLF) data included.
- Step 2: Explore the pre-filled sheets and familiarize yourself with the key metrics.
- Step 3: Update forecasts and assumptions in the editable yellow cells (WACC, growth, margins).
- Step 4: Instantly view recalculated results, including Cleveland-Cliffs Inc. (CLF)'s intrinsic value.
- Step 5: Make informed investment decisions or generate reports using the outputs.
Why Choose This Calculator for Cleveland-Cliffs Inc. (CLF)?
- Accurate Data: Authentic Cleveland-Cliffs financials provide dependable valuation outcomes.
- Customizable: Tailor essential parameters such as growth rates, WACC, and tax rates to align with your forecasts.
- Time-Saving: Pre-configured calculations save you from starting from the ground up.
- Professional-Grade Tool: Crafted for investors, analysts, and consultants in the industry.
- User-Friendly: Easy-to-navigate design and clear instructions make it accessible for all users.
Who Should Use This Product?
- Investors: Accurately assess Cleveland-Cliffs Inc.'s (CLF) fair value before making investment choices.
- CFOs: Utilize a professional-grade DCF model for financial reporting and analysis related to Cleveland-Cliffs Inc. (CLF).
- Consultants: Quickly tailor the template for valuation reports specific to Cleveland-Cliffs Inc. (CLF) for clients.
- Entrepreneurs: Gain insights into financial modeling practices employed by leading steel producers like Cleveland-Cliffs Inc. (CLF).
- Educators: Employ it as a teaching resource to illustrate valuation methodologies with a focus on Cleveland-Cliffs Inc. (CLF).
What the Template Contains
- Comprehensive DCF Model: Editable template featuring detailed valuation calculations for Cleveland-Cliffs Inc. (CLF).
- Real-World Data: Cleveland-Cliffs Inc.'s historical and projected financials preloaded for thorough analysis.
- Customizable Parameters: Modify WACC, growth rates, and tax assumptions to explore various scenarios.
- Financial Statements: Complete annual and quarterly breakdowns for enhanced insights into Cleveland-Cliffs Inc. (CLF).
- Key Ratios: Integrated analysis for profitability, efficiency, and leverage specific to Cleveland-Cliffs Inc. (CLF).
- Dashboard with Visual Outputs: Charts and tables designed for clear, actionable results relevant to Cleveland-Cliffs Inc. (CLF).
Disclaimer
All information, articles, and product details provided on this website are for general informational and educational purposes only. We do not claim any ownership over, nor do we intend to infringe upon, any trademarks, copyrights, logos, brand names, or other intellectual property mentioned or depicted on this site. Such intellectual property remains the property of its respective owners, and any references here are made solely for identification or informational purposes, without implying any affiliation, endorsement, or partnership.
We make no representations or warranties, express or implied, regarding the accuracy, completeness, or suitability of any content or products presented. Nothing on this website should be construed as legal, tax, investment, financial, medical, or other professional advice. In addition, no part of this site—including articles or product references—constitutes a solicitation, recommendation, endorsement, advertisement, or offer to buy or sell any securities, franchises, or other financial instruments, particularly in jurisdictions where such activity would be unlawful.
All content is of a general nature and may not address the specific circumstances of any individual or entity. It is not a substitute for professional advice or services. Any actions you take based on the information provided here are strictly at your own risk. You accept full responsibility for any decisions or outcomes arising from your use of this website and agree to release us from any liability in connection with your use of, or reliance upon, the content or products found herein.