
|
Costco Wholesale Corporation (Cost) DCF تقييم |
Fully Editable: Tailor To Your Needs In Excel Or Sheets
Professional Design: Trusted, Industry-Standard Templates
Investor-Approved Valuation Models
MAC/PC Compatible, Fully Unlocked
No Expertise Is Needed; Easy To Follow
Costco Wholesale Corporation (COST) Bundle
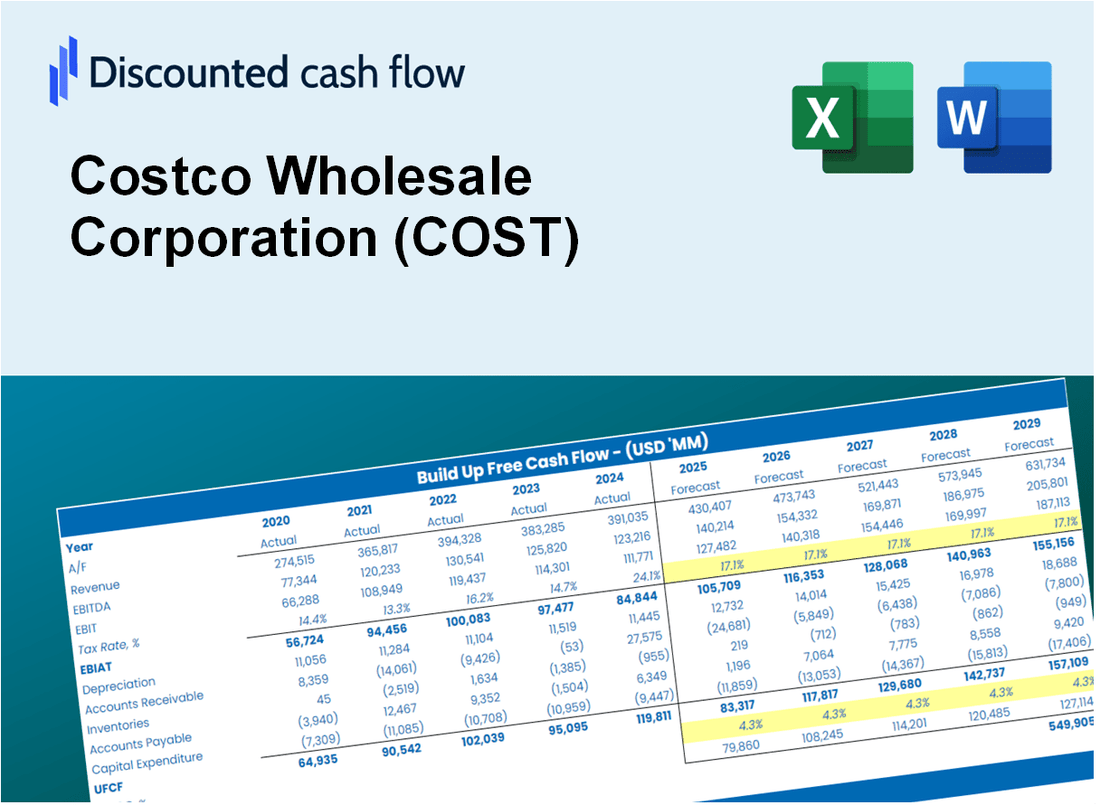
ارفع تحليل تقييم Costco Wholesale Corporation (التكلفة) باستخدام حاسبة DCF المتطورة! تم تحميله مسبقًا ببيانات (تكلفة) حقيقية ، يمكّنك هذا القالب Excel من ضبط التوقعات والافتراضات لتحديد القيمة الجوهرية لـ Costco بدقة.
Discounted Cash Flow (DCF) - (USD MM)
| Year | AY1 2021 |
AY2 2022 |
AY3 2023 |
AY4 2024 |
AY5 2025 |
FY1 2026 |
FY2 2027 |
FY3 2028 |
FY4 2029 |
FY5 2030 |
|---|---|---|---|---|---|---|---|---|---|---|
| Revenue | 195,929.0 | 226,954.0 | 242,290.0 | 254,453.0 | 275,235.0 | 299,854.4 | 326,676.0 | 355,896.7 | 387,731.2 | 422,413.3 |
| Revenue Growth, % | 0 | 15.83 | 6.76 | 5.02 | 8.17 | 8.94 | 8.94 | 8.94 | 8.94 | 8.94 |
| EBITDA | 8,918.0 | 10,275.0 | 11,136.0 | 12,146.0 | 13,398.0 | 13,983.0 | 15,233.8 | 16,596.4 | 18,081.0 | 19,698.3 |
| EBITDA, % | 4.55 | 4.53 | 4.6 | 4.77 | 4.87 | 4.66 | 4.66 | 4.66 | 4.66 | 4.66 |
| Depreciation | 2,067.0 | 2,277.0 | 2,489.0 | 2,237.0 | 2,426.0 | 2,906.3 | 3,166.2 | 3,449.4 | 3,758.0 | 4,094.1 |
| Depreciation, % | 1.05 | 1 | 1.03 | 0.87914 | 0.88143 | 0.96922 | 0.96922 | 0.96922 | 0.96922 | 0.96922 |
| EBIT | 6,851.0 | 7,998.0 | 8,647.0 | 9,909.0 | 10,972.0 | 11,076.8 | 12,067.6 | 13,147.0 | 14,323.0 | 15,604.2 |
| EBIT, % | 3.5 | 3.52 | 3.57 | 3.89 | 3.99 | 3.69 | 3.69 | 3.69 | 3.69 | 3.69 |
| Total Cash | 12,175.0 | 11,049.0 | 15,234.0 | 11,144.0 | 15,284.0 | 16,373.6 | 17,838.2 | 19,433.8 | 21,172.1 | 23,065.9 |
| Total Cash, percent | .0 | .0 | .0 | .0 | .0 | .0 | .0 | .0 | .0 | .0 |
| Account Receivables | 1,803.0 | 2,241.0 | 2,285.0 | 2,721.0 | 3,203.0 | 3,048.8 | 3,321.5 | 3,618.6 | 3,942.3 | 4,295.0 |
| Account Receivables, % | 0.92023 | 0.98742 | 0.94308 | 1.07 | 1.16 | 1.02 | 1.02 | 1.02 | 1.02 | 1.02 |
| Inventories | 14,215.0 | 17,907.0 | 16,651.0 | 18,647.0 | 18,116.0 | 21,546.3 | 23,473.6 | 25,573.3 | 27,860.8 | 30,352.9 |
| Inventories, % | 7.26 | 7.89 | 6.87 | 7.33 | 6.58 | 7.19 | 7.19 | 7.19 | 7.19 | 7.19 |
| Accounts Payable | 16,278.0 | 17,848.0 | 17,483.0 | 19,421.0 | 19,783.0 | 22,913.7 | 24,963.4 | 27,196.3 | 29,629.0 | 32,279.2 |
| Accounts Payable, % | 8.31 | 7.86 | 7.22 | 7.63 | 7.19 | 7.64 | 7.64 | 7.64 | 7.64 | 7.64 |
| Capital Expenditure | -3,588.0 | -3,891.0 | -4,323.0 | -4,710.0 | -5,498.0 | -5,504.5 | -5,996.8 | -6,533.2 | -7,117.6 | -7,754.3 |
| Capital Expenditure, % | -1.83 | -1.71 | -1.78 | -1.85 | -2 | -1.84 | -1.84 | -1.84 | -1.84 | -1.84 |
| Tax Rate, % | 25.13 | 25.13 | 25.13 | 25.13 | 25.13 | 25.13 | 25.13 | 25.13 | 25.13 | 25.13 |
| EBITAT | 5,135.2 | 5,961.8 | 6,410.6 | 7,494.8 | 8,214.3 | 8,288.4 | 9,029.8 | 9,837.5 | 10,717.5 | 11,676.1 |
| Depreciation | ||||||||||
| Changes in Account Receivables | ||||||||||
| Changes in Inventories | ||||||||||
| Changes in Accounts Payable | ||||||||||
| Capital Expenditure | ||||||||||
| UFCF | 3,874.2 | 1,787.8 | 5,423.6 | 4,527.8 | 5,553.3 | 5,544.9 | 6,048.8 | 6,589.9 | 7,179.3 | 7,821.5 |
| WACC, % | 8.27 | 8.27 | 8.27 | 8.27 | 8.27 | 8.27 | 8.27 | 8.27 | 8.27 | 8.27 |
| PV UFCF | ||||||||||
| SUM PV UFCF | 25,958.1 | |||||||||
| Long Term Growth Rate, % | 3.00 | |||||||||
| Free cash flow (T + 1) | 8,056 | |||||||||
| Terminal Value | 152,979 | |||||||||
| Present Terminal Value | 102,841 | |||||||||
| Enterprise Value | 128,799 | |||||||||
| Net Debt | -5,988 | |||||||||
| Equity Value | 134,787 | |||||||||
| Diluted Shares Outstanding, MM | 445 | |||||||||
| Equity Value Per Share | 303.03 |
What You Will Get
- Real COST Financials: Access to historical and projected data for precise valuation.
- Customizable Inputs: Adjust WACC, tax rates, revenue growth, and capital expenditures as needed.
- Dynamic Calculations: Intrinsic value and NPV are computed in real-time.
- Scenario Analysis: Evaluate various scenarios to assess Costco’s future performance.
- User-Friendly Design: Designed for professionals while remaining approachable for newcomers.
Key Features
- Comprehensive Financial Model: Provides detailed projections for revenue, expenses, and cash flow tailored for Costco Wholesale Corporation (COST).
- Cost Structure Analysis: In-depth breakdown of fixed and variable costs to enhance financial planning.
- Customizable Growth Projections: Adjust assumptions for sales growth, membership fees, and operating margins.
- Integrated Key Performance Indicators: Evaluate metrics such as same-store sales growth and inventory turnover for Costco.
- User-Friendly Dashboard: Visual representations of financial health and performance metrics for quick insights.
How It Works
- Download: Obtain the comprehensive Excel file featuring Costco's financial data.
- Customize: Tailor forecasts, including sales growth, EBITDA %, and WACC.
- Update Automatically: The intrinsic value and NPV calculations refresh in real-time.
- Test Scenarios: Generate various projections and evaluate results instantly.
- Make Decisions: Leverage the valuation outcomes to inform your investment approach.
Why Choose This Calculator for Costco Wholesale Corporation (COST)?
- Comprehensive Tool: Incorporates DCF, WACC, and financial ratio analyses tailored for Costco.
- Customizable Inputs: Modify highlighted cells to explore different financial scenarios for (COST).
- Detailed Insights: Automatically computes Costco's intrinsic value and Net Present Value.
- Preloaded Data: Access historical and projected data for accurate financial assessments.
- Professional Quality: Perfect for financial analysts, investors, and consultants focusing on (COST).
Who Should Use This Product?
- Investors: Evaluate Costco’s valuation before making stock transactions.
- CFOs and Financial Analysts: Optimize valuation workflows and assess future projections.
- Startup Founders: Understand how large public companies like Costco are appraised.
- Consultants: Provide detailed valuation reports for client needs.
- Students and Educators: Utilize real-world data to practice and instruct on valuation methods.
What the Template Contains
- Comprehensive DCF Model: Editable template featuring detailed valuation calculations.
- Real-World Data: Costco’s historical and projected financials preloaded for analysis.
- Customizable Parameters: Adjust WACC, growth rates, and tax assumptions to explore various scenarios.
- Financial Statements: Complete annual and quarterly breakdowns for in-depth insights.
- Key Ratios: Integrated analysis for profitability, efficiency, and leverage metrics.
- Dashboard with Visual Outputs: Charts and tables designed for clear, actionable results.
Disclaimer
All information, articles, and product details provided on this website are for general informational and educational purposes only. We do not claim any ownership over, nor do we intend to infringe upon, any trademarks, copyrights, logos, brand names, or other intellectual property mentioned or depicted on this site. Such intellectual property remains the property of its respective owners, and any references here are made solely for identification or informational purposes, without implying any affiliation, endorsement, or partnership.
We make no representations or warranties, express or implied, regarding the accuracy, completeness, or suitability of any content or products presented. Nothing on this website should be construed as legal, tax, investment, financial, medical, or other professional advice. In addition, no part of this site—including articles or product references—constitutes a solicitation, recommendation, endorsement, advertisement, or offer to buy or sell any securities, franchises, or other financial instruments, particularly in jurisdictions where such activity would be unlawful.
All content is of a general nature and may not address the specific circumstances of any individual or entity. It is not a substitute for professional advice or services. Any actions you take based on the information provided here are strictly at your own risk. You accept full responsibility for any decisions or outcomes arising from your use of this website and agree to release us from any liability in connection with your use of, or reliance upon, the content or products found herein.