
|
Eltek Ltd. (Eltk) تقييم DCF |
Fully Editable: Tailor To Your Needs In Excel Or Sheets
Professional Design: Trusted, Industry-Standard Templates
Investor-Approved Valuation Models
MAC/PC Compatible, Fully Unlocked
No Expertise Is Needed; Easy To Follow
Eltek Ltd. (ELTK) Bundle
اكتشف الإمكانات الحقيقية لشركة Eltek Ltd. (ELTK) مع حاسبة DCF المتقدمة! ضبط الافتراضات الرئيسية، واستكشاف سيناريوهات مختلفة، وتقييم كيفية تأثير التغييرات على Eltek Ltd. (ELTK) - كل ذلك ضمن نموذج Excel واحد.
What You Will Get
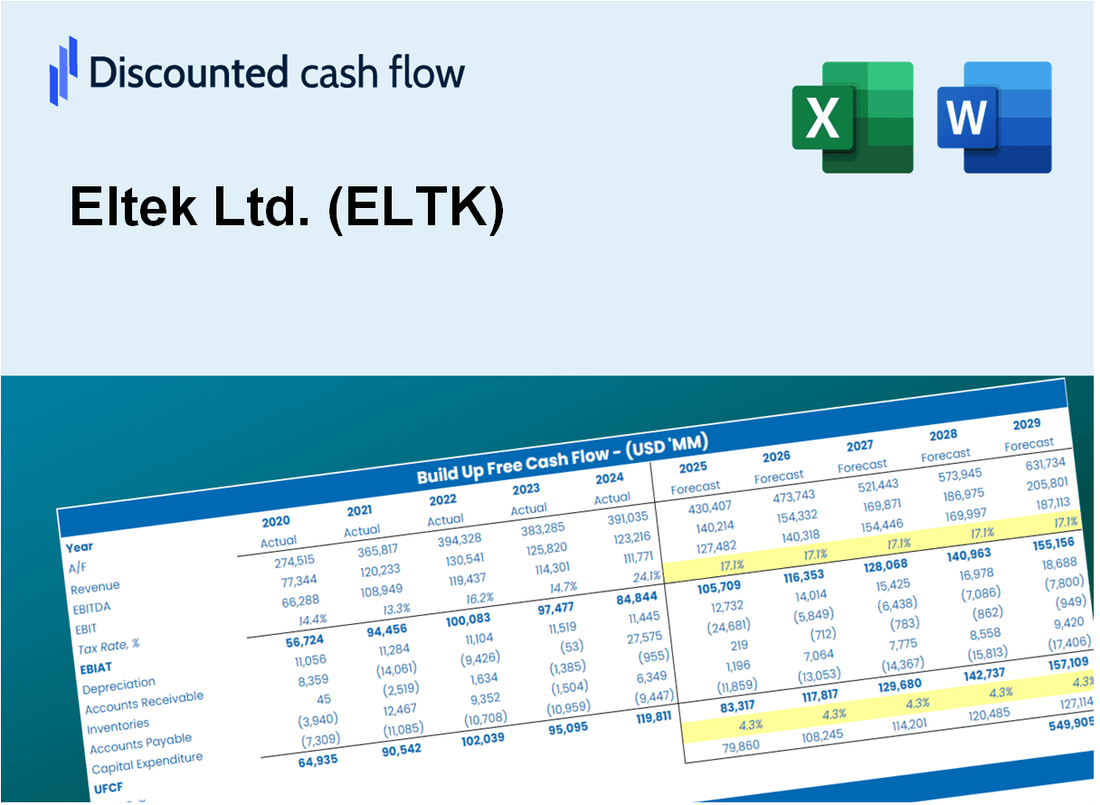
- Real ELTK Financial Data: Pre-filled with Eltek Ltd.’s historical and projected data for precise analysis.
- Fully Editable Template: Modify key inputs like revenue growth, WACC, and EBITDA % with ease.
- Automatic Calculations: See Eltek Ltd.’s intrinsic value update instantly based on your changes.
- Professional Valuation Tool: Designed for investors, analysts, and consultants seeking accurate DCF results.
- User-Friendly Design: Simple structure and clear instructions for all experience levels.
Key Features
- Comprehensive ELTK Data: Pre-populated with Eltek Ltd.'s historical financials and future projections.
- Fully Customizable Inputs: Modify revenue growth rates, profit margins, WACC, tax rates, and capital expenditures.
- Dynamic Valuation Model: Instant updates to Net Present Value (NPV) and intrinsic value based on your adjustments.
- Scenario Analysis: Develop various forecast scenarios to evaluate different valuation results.
- User-Friendly Interface: Intuitive, well-structured, suitable for both professionals and novices.
How It Works
- Step 1: Download the Excel file.
- Step 2: Review Eltek Ltd.'s pre-filled financial data and forecasts.
- Step 3: Modify key inputs such as revenue growth, WACC, and tax rates (highlighted cells).
- Step 4: Observe the DCF model update in real-time as you adjust the assumptions.
- Step 5: Analyze the outputs and leverage the results for investment decisions.
Why Choose This Calculator for Eltek Ltd. (ELTK)?
- User-Friendly Interface: Tailored for both novices and seasoned professionals.
- Customizable Inputs: Adjust parameters effortlessly to suit your financial analysis.
- Real-Time Feedback: Watch Eltek’s valuation change dynamically as you tweak your inputs.
- Preloaded Data: Comes equipped with Eltek’s latest financial metrics for swift evaluations.
- Relied Upon by Experts: Favored by analysts and investors for making strategic choices.
Who Should Use This Product?
- Professional Investors: Develop comprehensive and accurate valuation models for analyzing Eltek Ltd. (ELTK) investments.
- Corporate Finance Teams: Evaluate valuation scenarios to inform strategic decisions within the organization.
- Consultants and Advisors: Deliver precise valuation insights for clients interested in Eltek Ltd. (ELTK) stock.
- Students and Educators: Utilize real-time data to enhance learning and practice in financial modeling.
- Tech Enthusiasts: Gain insights into how companies like Eltek Ltd. (ELTK) are assessed in the financial market.
What the Template Contains
- Pre-Filled DCF Model: Eltek Ltd.'s (ELTK) financial data preloaded for immediate use.
- WACC Calculator: Detailed calculations for Weighted Average Cost of Capital.
- Financial Ratios: Evaluate Eltek Ltd.'s (ELTK) profitability, leverage, and efficiency.
- Editable Inputs: Change assumptions such as growth, margins, and CAPEX to fit your scenarios.
- Financial Statements: Annual and quarterly reports to support detailed analysis.
- Interactive Dashboard: Easily visualize key valuation metrics and results.
Disclaimer
All information, articles, and product details provided on this website are for general informational and educational purposes only. We do not claim any ownership over, nor do we intend to infringe upon, any trademarks, copyrights, logos, brand names, or other intellectual property mentioned or depicted on this site. Such intellectual property remains the property of its respective owners, and any references here are made solely for identification or informational purposes, without implying any affiliation, endorsement, or partnership.
We make no representations or warranties, express or implied, regarding the accuracy, completeness, or suitability of any content or products presented. Nothing on this website should be construed as legal, tax, investment, financial, medical, or other professional advice. In addition, no part of this site—including articles or product references—constitutes a solicitation, recommendation, endorsement, advertisement, or offer to buy or sell any securities, franchises, or other financial instruments, particularly in jurisdictions where such activity would be unlawful.
All content is of a general nature and may not address the specific circumstances of any individual or entity. It is not a substitute for professional advice or services. Any actions you take based on the information provided here are strictly at your own risk. You accept full responsibility for any decisions or outcomes arising from your use of this website and agree to release us from any liability in connection with your use of, or reliance upon, the content or products found herein.