
|
شركة فارمر بروس (مزرعة) تقييم DCF |
Fully Editable: Tailor To Your Needs In Excel Or Sheets
Professional Design: Trusted, Industry-Standard Templates
Investor-Approved Valuation Models
MAC/PC Compatible, Fully Unlocked
No Expertise Is Needed; Easy To Follow
Farmer Bros. Co. (FARM) Bundle
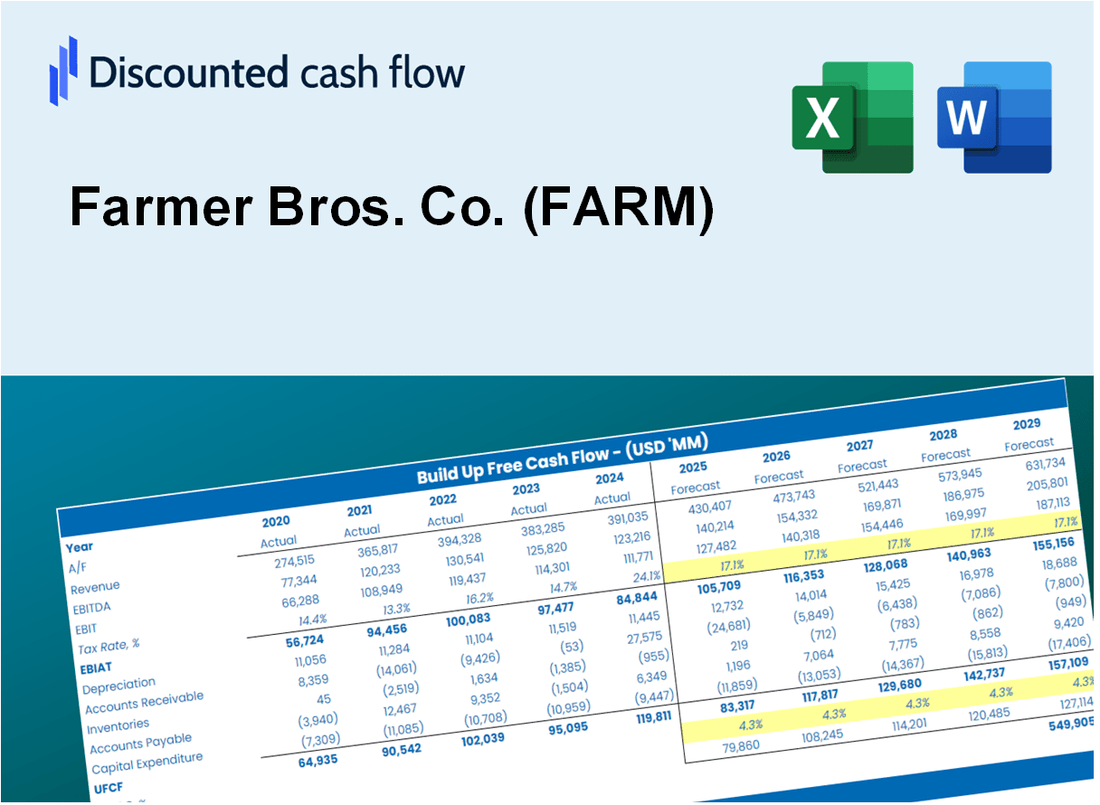
تُمكّنك حاسبة DCF (المزرعة) الخاصة بنا (المزرعة) من تقييم التقييم باستخدام بيانات مالية شاملة باستخدام بيانات مالية شاملة وتوفر مرونة كاملة لتعديل جميع المعلمات الأساسية للتوقعات المحسنة.
What You Will Get
- Real Farmer Bros. Data: Preloaded financials – from revenue to EBIT – based on actual and projected figures.
- Full Customization: Adjust all critical parameters (yellow cells) like WACC, growth %, and tax rates.
- Instant Valuation Updates: Automatic recalculations to analyze the impact of changes on Farmer Bros. Co.'s fair value.
- Versatile Excel Template: Tailored for quick edits, scenario testing, and detailed projections.
- Time-Saving and Accurate: Skip building models from scratch while maintaining precision and flexibility.
Key Features
- Comprehensive Data: Farmer Bros. Co. (FARM) historical financial statements and pre-filled forecasts.
- Customizable Inputs: Adjust WACC, tax rates, revenue growth, and EBITDA margins as needed.
- Real-Time Insights: View the intrinsic value of Farmer Bros. Co. (FARM) recalculating instantly.
- Intuitive Visualizations: Dashboard charts present valuation results and essential metrics clearly.
- Designed for Precision: A professional-grade tool for analysts, investors, and finance professionals.
How It Works
- Download the Template: Gain immediate access to the Excel-based FARM DCF Calculator.
- Input Your Assumptions: Modify the yellow-highlighted cells for growth rates, WACC, margins, and additional parameters.
- Instant Calculations: The model automatically recalculates Farmer Bros. Co.'s intrinsic value.
- Test Scenarios: Experiment with various assumptions to assess potential changes in valuation.
- Analyze and Decide: Utilize the outcomes to inform your investment or financial assessment.
Why Choose Farmer Bros. Co. (FARM)?
- Quality Products: Our commitment to excellence ensures top-notch coffee and tea offerings.
- Innovative Solutions: We leverage cutting-edge technology to enhance your beverage experience.
- Customer-Centric Approach: Tailored services and support to meet the unique needs of your business.
- Proven Track Record: Trusted by thousands of clients for our reliability and consistency.
- Sustainable Practices: We prioritize environmentally friendly methods in our sourcing and operations.
Who Should Use This Product?
- Investors: Accurately estimate Farmer Bros. Co.’s (FARM) fair value before making investment decisions.
- CFOs: Utilize a professional-grade DCF model for financial reporting and analysis specific to Farmer Bros. Co. (FARM).
- Consultants: Easily customize the template for valuation reports tailored to clients focused on Farmer Bros. Co. (FARM).
- Entrepreneurs: Discover financial modeling techniques employed by industry leaders, including Farmer Bros. Co. (FARM).
- Educators: Implement it as a teaching resource to illustrate valuation methodologies relevant to Farmer Bros. Co. (FARM).
What the Template Contains
- Comprehensive DCF Model: Editable template featuring detailed valuation calculations tailored for Farmer Bros. Co. (FARM).
- Real-World Data: Historical and projected financials for Farmer Bros. Co. (FARM) preloaded for in-depth analysis.
- Customizable Parameters: Modify WACC, growth rates, and tax assumptions to explore various scenarios.
- Financial Statements: Complete annual and quarterly breakdowns to provide deeper insights into Farmer Bros. Co. (FARM).
- Key Ratios: Integrated analysis for profitability, efficiency, and leverage specific to Farmer Bros. Co. (FARM).
- Dashboard with Visual Outputs: Charts and tables designed to present clear, actionable results for Farmer Bros. Co. (FARM).
Disclaimer
All information, articles, and product details provided on this website are for general informational and educational purposes only. We do not claim any ownership over, nor do we intend to infringe upon, any trademarks, copyrights, logos, brand names, or other intellectual property mentioned or depicted on this site. Such intellectual property remains the property of its respective owners, and any references here are made solely for identification or informational purposes, without implying any affiliation, endorsement, or partnership.
We make no representations or warranties, express or implied, regarding the accuracy, completeness, or suitability of any content or products presented. Nothing on this website should be construed as legal, tax, investment, financial, medical, or other professional advice. In addition, no part of this site—including articles or product references—constitutes a solicitation, recommendation, endorsement, advertisement, or offer to buy or sell any securities, franchises, or other financial instruments, particularly in jurisdictions where such activity would be unlawful.
All content is of a general nature and may not address the specific circumstances of any individual or entity. It is not a substitute for professional advice or services. Any actions you take based on the information provided here are strictly at your own risk. You accept full responsibility for any decisions or outcomes arising from your use of this website and agree to release us from any liability in connection with your use of, or reliance upon, the content or products found herein.