
|
FB Financial Corporation (FBK) DCF تقييم |
Fully Editable: Tailor To Your Needs In Excel Or Sheets
Professional Design: Trusted, Industry-Standard Templates
Investor-Approved Valuation Models
MAC/PC Compatible, Fully Unlocked
No Expertise Is Needed; Easy To Follow
FB Financial Corporation (FBK) Bundle
اكتشف القيمة الحقيقية لشركة FB Financial Corporation (FBK) باستخدام حاسبة DCF من الدرجة المهنية! قم بتعديل الافتراضات الرئيسية، واستكشاف السيناريوهات المختلفة، وتقييم كيفية تأثير التغييرات المختلفة على تقييم FB Financial Corporation (FBK) - كل ذلك ضمن نموذج Excel واحد.
What You Will Get
- Editable Forecast Inputs: Easily modify assumptions (growth %, margins, WACC) to explore various scenarios.
- Real-World Data: FB Financial Corporation’s (FBK) financial data pre-loaded to facilitate your analysis.
- Automatic DCF Outputs: The template computes Net Present Value (NPV) and intrinsic value automatically.
- Customizable and Professional: A refined Excel model tailored to meet your valuation requirements.
- Built for Analysts and Investors: Perfect for evaluating projections, confirming strategies, and enhancing efficiency.
Key Features
- Customizable Financial Inputs: Adjust essential parameters such as loan growth, net interest margin, and operating expenses.
- Instant DCF Valuation: Provides immediate calculations for intrinsic value, NPV, and other financial metrics.
- High-Precision Analytics: Leverages FB Financial Corporation's actual financial data for accurate valuation insights.
- Effortless Scenario Testing: Easily explore various assumptions and analyze their impacts on outcomes.
- Efficiency Booster: Streamline the valuation process without the need for intricate model development.
How It Works
- Step 1: Download the prebuilt Excel template featuring FB Financial Corporation’s (FBK) data.
- Step 2: Navigate through the pre-filled sheets to grasp the essential metrics.
- Step 3: Modify forecasts and assumptions in the editable yellow cells (WACC, growth, margins).
- Step 4: Instantly observe the recalculated results, including FB Financial Corporation’s (FBK) intrinsic value.
- Step 5: Make well-informed investment decisions or create reports based on the outputs.
Why Choose FB Financial Corporation (FBK)?
- User-Friendly Interface: Tailored for both novice users and seasoned professionals.
- Customizable Parameters: Adjust inputs easily to suit your financial analysis needs.
- Real-Time Feedback: Observe immediate changes in FB Financial’s metrics as you modify inputs.
- Pre-Loaded Data: Comes equipped with FB Financial’s actual financial figures for swift evaluations.
- Relied Upon by Experts: Favored by investors and analysts for making well-informed financial choices.
Who Should Use FB Financial Corporation (FBK)?
- Investors: Make informed choices with a reliable financial services provider.
- Financial Analysts: Streamline your analysis with comprehensive banking solutions tailored for your needs.
- Consultants: Easily modify offerings to meet client requirements and enhance presentations.
- Finance Enthusiasts: Expand your knowledge of banking practices through real-life case studies.
- Educators and Students: Utilize it as a valuable resource for finance-related education and practical applications.
What the Template Contains
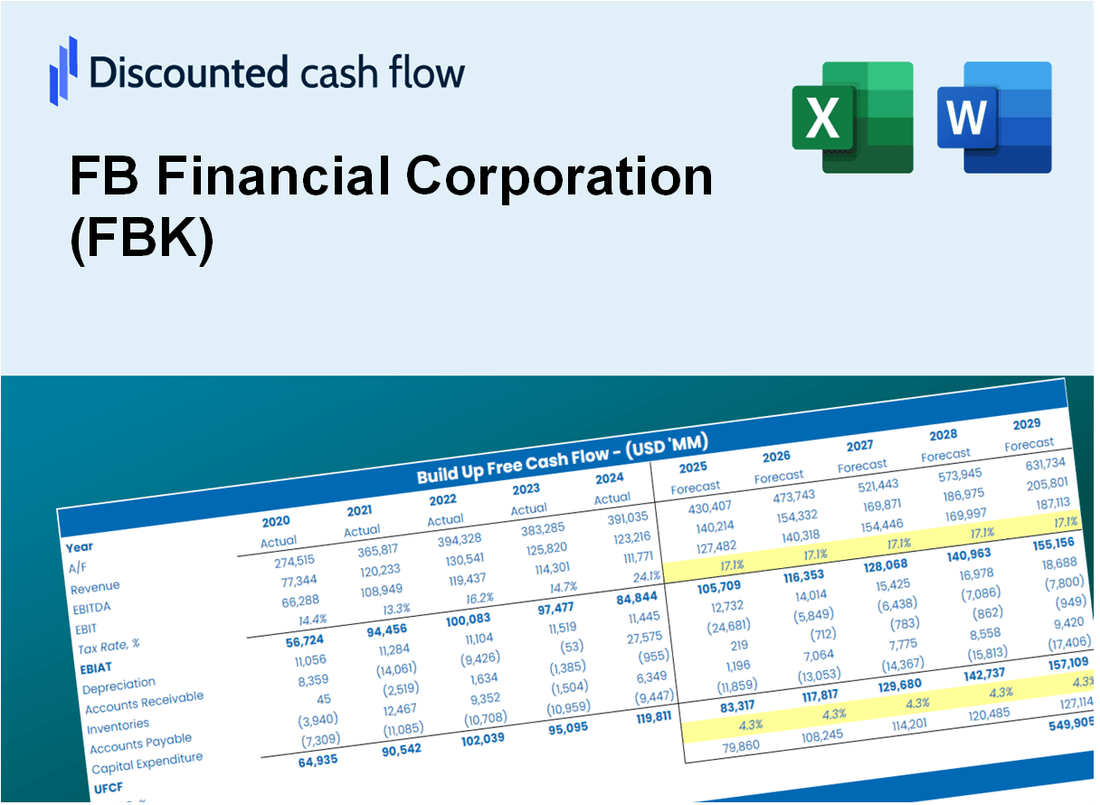
- Operating and Balance Sheet Data: Pre-filled FB Financial Corporation (FBK) historical data and forecasts, including revenue, EBITDA, EBIT, and capital expenditures.
- WACC Calculation: A dedicated sheet for Weighted Average Cost of Capital (WACC), including parameters like Beta, risk-free rate, and share price.
- DCF Valuation (Unlevered and Levered): Editable Discounted Cash Flow models showing intrinsic value with detailed calculations.
- Financial Statements: Pre-loaded financial statements (annual and quarterly) to support analysis.
- Key Ratios: Includes profitability, leverage, and efficiency ratios for FB Financial Corporation (FBK).
- Dashboard and Charts: Visual summary of valuation outputs and assumptions to analyze results easily.
Disclaimer
All information, articles, and product details provided on this website are for general informational and educational purposes only. We do not claim any ownership over, nor do we intend to infringe upon, any trademarks, copyrights, logos, brand names, or other intellectual property mentioned or depicted on this site. Such intellectual property remains the property of its respective owners, and any references here are made solely for identification or informational purposes, without implying any affiliation, endorsement, or partnership.
We make no representations or warranties, express or implied, regarding the accuracy, completeness, or suitability of any content or products presented. Nothing on this website should be construed as legal, tax, investment, financial, medical, or other professional advice. In addition, no part of this site—including articles or product references—constitutes a solicitation, recommendation, endorsement, advertisement, or offer to buy or sell any securities, franchises, or other financial instruments, particularly in jurisdictions where such activity would be unlawful.
All content is of a general nature and may not address the specific circumstances of any individual or entity. It is not a substitute for professional advice or services. Any actions you take based on the information provided here are strictly at your own risk. You accept full responsibility for any decisions or outcomes arising from your use of this website and agree to release us from any liability in connection with your use of, or reliance upon, the content or products found herein.