
|
نقل القلعة والبنية التحتية المستثمرين LLC (FTAI) DCF تقييم |
Fully Editable: Tailor To Your Needs In Excel Or Sheets
Professional Design: Trusted, Industry-Standard Templates
Investor-Approved Valuation Models
MAC/PC Compatible, Fully Unlocked
No Expertise Is Needed; Easy To Follow
Fortress Transportation and Infrastructure Investors LLC (FTAI) Bundle
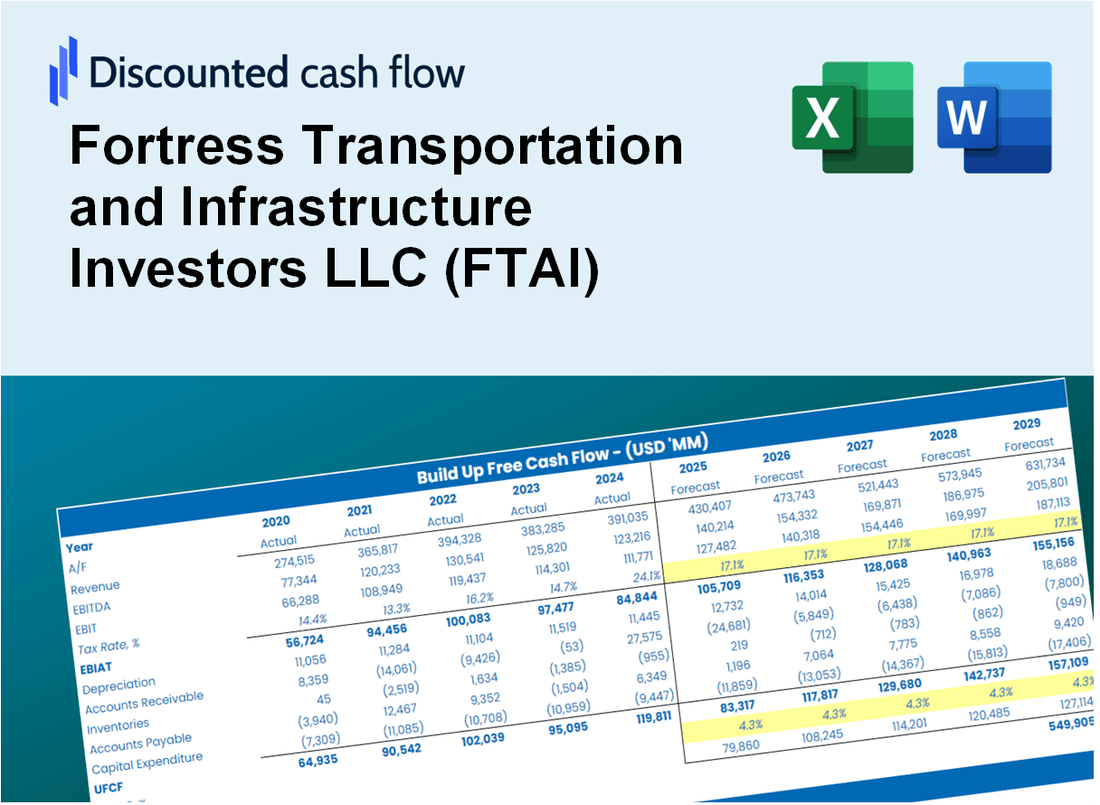
هندسي من أجل الدقة ، تمكنك حاسبة DCF (FTAI) لدينا من تقييم تقييم نقل القلعة والبنية التحتية المستثمرين LLC باستخدام البيانات المالية في العالم الحقيقي ، مما يوفر مرونة كاملة لتعديل جميع المعلمات الأساسية للتوقعات المحسنة.
What You Will Receive
- Accurate FTAI Financial Data: Pre-loaded with Fortress Transportation and Infrastructure Investors LLC’s historical and forecasted data for thorough analysis.
- Completely Customizable Template: Easily adjust essential inputs such as revenue growth, WACC, and EBITDA %.
- Instant Calculations: Observe FTAI’s intrinsic value update in real-time as you make adjustments.
- Expert Valuation Tool: Crafted for investors, analysts, and consultants aiming for precise DCF outcomes.
- Intuitive Design: Straightforward layout and clear guidelines suitable for all skill levels.
Key Features
- 🔍 Real-Life FTAI Financials: Pre-filled historical and projected data for Fortress Transportation and Infrastructure Investors LLC (FTAI).
- ✏️ Fully Customizable Inputs: Adjust all critical parameters (yellow cells) like WACC, growth %, and tax rates.
- 📊 Professional DCF Valuation: Built-in formulas calculate FTAI’s intrinsic value using the Discounted Cash Flow method.
- ⚡ Instant Results: Visualize FTAI’s valuation instantly after making changes.
- Scenario Analysis: Test and compare outcomes for various financial assumptions side-by-side.
How It Works
- Step 1: Download the prebuilt Excel template containing FTAI’s data.
- Step 2: Navigate through the pre-filled sheets to familiarize yourself with the essential metrics.
- Step 3: Modify forecasts and assumptions in the editable yellow cells (WACC, growth, margins).
- Step 4: Instantly see the updated results, including FTAI’s intrinsic value.
- Step 5: Utilize the outputs to make informed investment decisions or create reports.
Why Choose This Calculator for Fortress Transportation and Infrastructure Investors LLC (FTAI)?
- All-in-One Solution: Combines DCF, WACC, and financial ratio analyses tailored for FTAI.
- Flexible Inputs: Modify the yellow-highlighted cells to explore different financial scenarios.
- In-Depth Analysis: Automatically computes FTAI’s intrinsic value and Net Present Value.
- Data-Rich Environment: Historical and projected data provide reliable benchmarks.
- Expert-Level Precision: Perfect for financial analysts, investors, and business strategists focused on FTAI.
Who Should Use This Product?
- Finance Students: Explore infrastructure investment strategies and apply them with real-world data.
- Academics: Integrate advanced financial models into your research or teaching materials.
- Investors: Validate your investment hypotheses and evaluate the performance of Fortress Transportation and Infrastructure Investors LLC (FTAI).
- Analysts: Enhance your analysis with a ready-to-use, customizable valuation model tailored for infrastructure investments.
- Small Business Owners: Understand the valuation processes used for large-scale infrastructure companies like Fortress Transportation and Infrastructure Investors LLC (FTAI).
What the Template Contains
- Comprehensive DCF Model: Editable template featuring detailed valuation calculations.
- Real-World Data: Fortress Transportation and Infrastructure Investors LLC’s (FTAI) historical and projected financials preloaded for analysis.
- Customizable Parameters: Modify WACC, growth rates, and tax assumptions to explore various scenarios.
- Financial Statements: Complete annual and quarterly breakdowns for enhanced insights.
- Key Ratios: Integrated analysis for profitability, efficiency, and leverage metrics.
- Dashboard with Visual Outputs: Charts and tables that provide clear, actionable results.
Disclaimer
All information, articles, and product details provided on this website are for general informational and educational purposes only. We do not claim any ownership over, nor do we intend to infringe upon, any trademarks, copyrights, logos, brand names, or other intellectual property mentioned or depicted on this site. Such intellectual property remains the property of its respective owners, and any references here are made solely for identification or informational purposes, without implying any affiliation, endorsement, or partnership.
We make no representations or warranties, express or implied, regarding the accuracy, completeness, or suitability of any content or products presented. Nothing on this website should be construed as legal, tax, investment, financial, medical, or other professional advice. In addition, no part of this site—including articles or product references—constitutes a solicitation, recommendation, endorsement, advertisement, or offer to buy or sell any securities, franchises, or other financial instruments, particularly in jurisdictions where such activity would be unlawful.
All content is of a general nature and may not address the specific circumstances of any individual or entity. It is not a substitute for professional advice or services. Any actions you take based on the information provided here are strictly at your own risk. You accept full responsibility for any decisions or outcomes arising from your use of this website and agree to release us from any liability in connection with your use of, or reliance upon, the content or products found herein.