
|
Gladstone Commercial Corporation (Good) DCF تقييم |
Fully Editable: Tailor To Your Needs In Excel Or Sheets
Professional Design: Trusted, Industry-Standard Templates
Investor-Approved Valuation Models
MAC/PC Compatible, Fully Unlocked
No Expertise Is Needed; Easy To Follow
Gladstone Commercial Corporation (GOOD) Bundle
تُمكّنك حاسبة DCF (الجيدة) التي تم تصميمها من أجل الدقة ، من تقييم تقييم شركة Gladstone Commercial Corporation باستخدام البيانات المالية في العالم الحقيقي ، مما يوفر مرونة كاملة لتعديل جميع المعلمات الأساسية للتوقعات المحسنة.
What You Will Get
- Real GOOD Financial Data: Pre-filled with Gladstone Commercial Corporation’s historical and projected data for precise analysis.
- Fully Editable Template: Modify key inputs like revenue growth, WACC, and EBITDA % with ease.
- Automatic Calculations: See Gladstone Commercial Corporation’s intrinsic value update instantly based on your changes.
- Professional Valuation Tool: Designed for investors, analysts, and consultants seeking accurate DCF results.
- User-Friendly Design: Simple structure and clear instructions for all experience levels.
Key Features
- Customizable Financial Inputs: Adjust essential parameters such as rental income growth, operating expenses, and capital investments.
- Instant DCF Valuation: Automatically computes intrinsic value, NPV, and additional financial metrics.
- High-Precision Accuracy: Leverages Gladstone Commercial Corporation's (GOOD) actual financial data for reliable valuation results.
- Simplified Scenario Analysis: Easily explore various assumptions and evaluate different outcomes.
- Efficiency Booster: Remove the hassle of constructing detailed valuation models from the ground up.
How It Works
- Download: Obtain the pre-formatted Excel file containing Gladstone Commercial Corporation's (GOOD) financial data.
- Customize: Modify projections, such as rental income growth, operating margins, and discount rates.
- Update Automatically: The intrinsic value and NPV calculations refresh in real-time.
- Test Scenarios: Develop various forecasts and analyze results immediately.
- Make Decisions: Leverage the valuation insights to inform your investment approach.
Why Choose Gladstone Commercial Corporation (GOOD)?
- Maximize Returns: Benefit from a well-established investment strategy tailored for real estate.
- Transparent Operations: Access clear and comprehensive reports to stay informed about your investments.
- Expert Management: Rely on a team of seasoned professionals with extensive industry experience.
- Diverse Portfolio: Invest in a variety of properties to spread risk and enhance stability.
- Strong Track Record: Join a company with a history of delivering consistent returns to its investors.
Who Should Use Gladstone Commercial Corporation (GOOD)?
- Real Estate Investors: Gain insights into commercial property investments with reliable data.
- Market Analysts: Utilize comprehensive reports to enhance your market analysis.
- Investment Advisors: Easily customize presentations for clients looking to invest in commercial real estate.
- Finance Students: Explore real-world applications of commercial property valuation and investment strategies.
- Portfolio Managers: Integrate Gladstone's offerings into your investment portfolio for diversification.
What the Template Contains
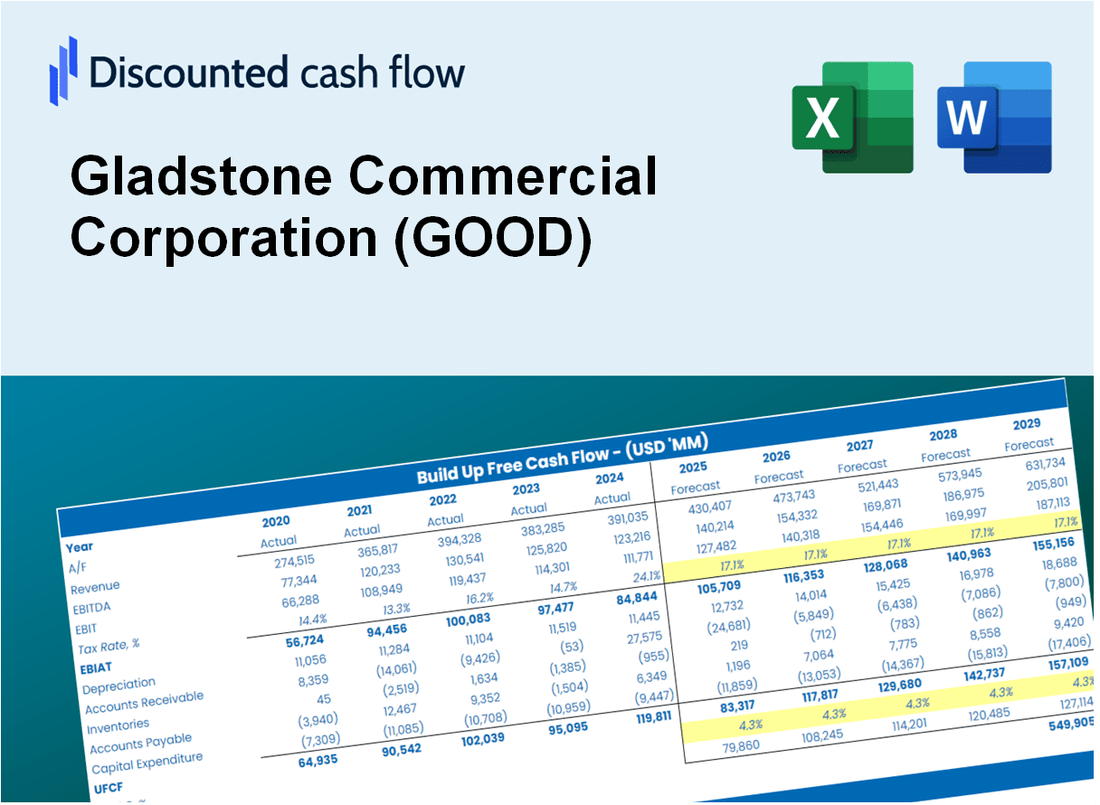
- Operating and Balance Sheet Data: Pre-filled Gladstone Commercial Corporation (GOOD) historical data and forecasts, including revenue, EBITDA, EBIT, and capital expenditures.
- WACC Calculation: A dedicated sheet for Weighted Average Cost of Capital (WACC), including parameters like Beta, risk-free rate, and share price.
- DCF Valuation (Unlevered and Levered): Editable Discounted Cash Flow models showing intrinsic value with detailed calculations.
- Financial Statements: Pre-loaded financial statements (annual and quarterly) to support analysis.
- Key Ratios: Includes profitability, leverage, and efficiency ratios for Gladstone Commercial Corporation (GOOD).
- Dashboard and Charts: Visual summary of valuation outputs and assumptions to analyze results easily.
Disclaimer
All information, articles, and product details provided on this website are for general informational and educational purposes only. We do not claim any ownership over, nor do we intend to infringe upon, any trademarks, copyrights, logos, brand names, or other intellectual property mentioned or depicted on this site. Such intellectual property remains the property of its respective owners, and any references here are made solely for identification or informational purposes, without implying any affiliation, endorsement, or partnership.
We make no representations or warranties, express or implied, regarding the accuracy, completeness, or suitability of any content or products presented. Nothing on this website should be construed as legal, tax, investment, financial, medical, or other professional advice. In addition, no part of this site—including articles or product references—constitutes a solicitation, recommendation, endorsement, advertisement, or offer to buy or sell any securities, franchises, or other financial instruments, particularly in jurisdictions where such activity would be unlawful.
All content is of a general nature and may not address the specific circumstances of any individual or entity. It is not a substitute for professional advice or services. Any actions you take based on the information provided here are strictly at your own risk. You accept full responsibility for any decisions or outcomes arising from your use of this website and agree to release us from any liability in connection with your use of, or reliance upon, the content or products found herein.