
|
The Goldman Sachs Group ، Inc. (GS) DCF تقييم |
Fully Editable: Tailor To Your Needs In Excel Or Sheets
Professional Design: Trusted, Industry-Standard Templates
Investor-Approved Valuation Models
MAC/PC Compatible, Fully Unlocked
No Expertise Is Needed; Easy To Follow
The Goldman Sachs Group, Inc. (GS) Bundle
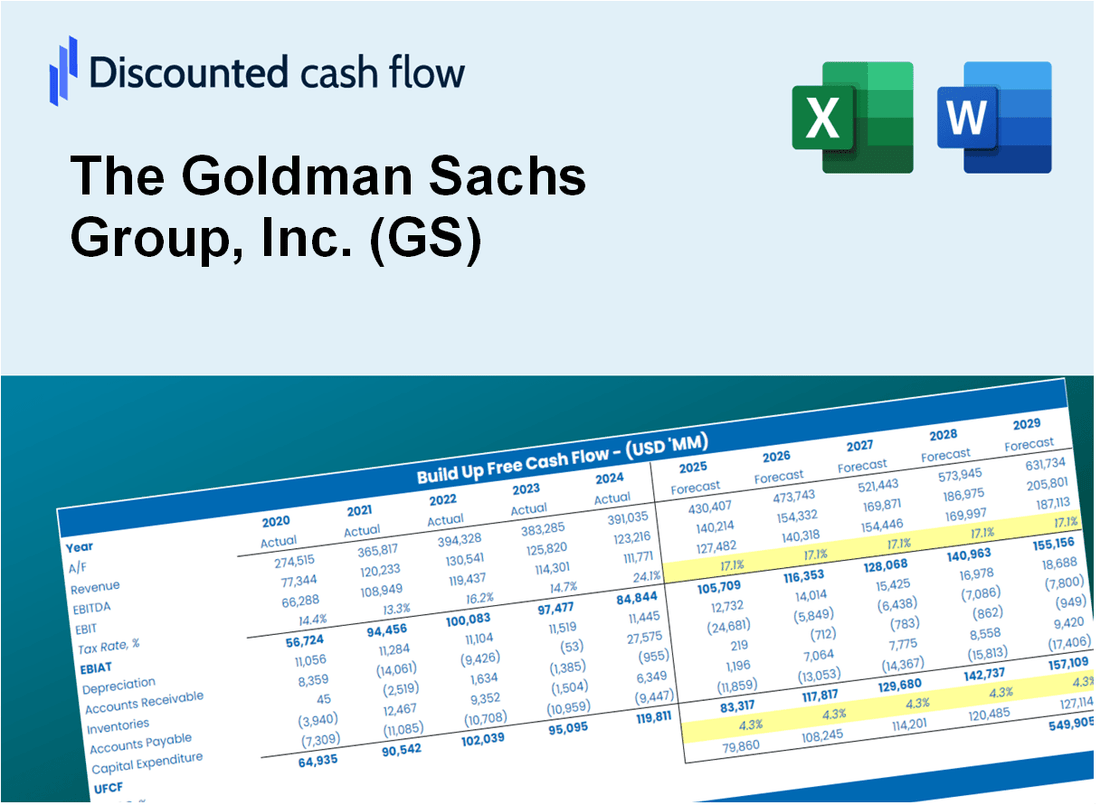
تعظيم الكفاءة وتحسين الدقة مع حاسبة (GS) DCF لدينا! مزودة ببيانات Goldman Sachs الفعلية والافتراضات القابلة للتخصيص ، تمكنك هذه الأداة من التنبؤ وتحليل وتقييم (GS) مثل المستثمر المحنك.
Discounted Cash Flow (DCF) - (USD MM)
| Year | AY1 2020 |
AY2 2021 |
AY3 2022 |
AY4 2023 |
AY5 2024 |
FY1 2025 |
FY2 2026 |
FY3 2027 |
FY4 2028 |
FY5 2029 |
|---|---|---|---|---|---|---|---|---|---|---|
| Revenue | 53,497.0 | 64,989.0 | 68,711.0 | 108,418.0 | 126,853.0 | 159,200.8 | 199,797.2 | 250,745.9 | 314,686.6 | 394,932.3 |
| Revenue Growth, % | 0 | 21.48 | 5.73 | 57.79 | 17 | 25.5 | 25.5 | 25.5 | 25.5 | 25.5 |
| EBITDA | 14,381.0 | 29,059.0 | 15,941.0 | 15,595.0 | 20,789.0 | 39,981.1 | 50,176.3 | 62,971.4 | 79,029.2 | 99,181.8 |
| EBITDA, % | 26.88 | 44.71 | 23.2 | 14.38 | 16.39 | 25.11 | 25.11 | 25.11 | 25.11 | 25.11 |
| Depreciation | 1,902.0 | 2,015.0 | 2,455.0 | 4,856.0 | 2,392.0 | 5,283.4 | 6,630.6 | 8,321.5 | 10,443.4 | 13,106.5 |
| Depreciation, % | 3.56 | 3.1 | 3.57 | 4.48 | 1.89 | 3.32 | 3.32 | 3.32 | 3.32 | 3.32 |
| EBIT | 12,479.0 | 27,044.0 | 13,486.0 | 10,739.0 | 18,397.0 | 34,697.7 | 43,545.7 | 54,649.9 | 68,585.7 | 86,075.2 |
| EBIT, % | 23.33 | 41.61 | 19.63 | 9.91 | 14.5 | 21.79 | 21.79 | 21.79 | 21.79 | 21.79 |
| Total Cash | 588,477.0 | 778,720.0 | 721,954.0 | 924,945.0 | 921,830.0 | 159,200.8 | 199,797.2 | 250,745.9 | 314,686.6 | 394,932.3 |
| Total Cash, percent | .0 | .0 | .0 | .0 | .0 | .0 | .0 | .0 | .0 | .0 |
| Account Receivables | 128,387.0 | 170,192.0 | 147,027.0 | 148,577.0 | 151,213.0 | 159,200.8 | 199,797.2 | 250,745.9 | 314,686.6 | 394,932.3 |
| Account Receivables, % | 239.99 | 261.88 | 213.98 | 137.04 | 119.2 | 100 | 100 | 100 | 100 | 100 |
| Inventories | .0 | .0 | .0 | .0 | .0 | .0 | .0 | .0 | .0 | .0 |
| Inventories, % | 0 | 0 | 0 | 0 | 0 | 0 | 0 | 0 | 0 | 0 |
| Accounts Payable | 190,658.0 | 251,931.0 | 262,045.0 | 230,728.0 | 223,255.0 | 159,200.8 | 199,797.2 | 250,745.9 | 314,686.6 | 394,932.3 |
| Accounts Payable, % | 356.39 | 387.65 | 381.37 | 212.81 | 176 | 100 | 100 | 100 | 100 | 100 |
| Capital Expenditure | -6,309.0 | -4,667.0 | -3,748.0 | -2,316.0 | -2,091.0 | -8,983.3 | -11,274.0 | -14,148.9 | -17,756.9 | -22,285.0 |
| Capital Expenditure, % | -11.79 | -7.18 | -5.45 | -2.14 | -1.65 | -5.64 | -5.64 | -5.64 | -5.64 | -5.64 |
| Tax Rate, % | 22.4 | 22.4 | 22.4 | 22.4 | 22.4 | 22.4 | 22.4 | 22.4 | 22.4 | 22.4 |
| EBITAT | 9,459.0 | 21,635.0 | 11,261.0 | 8,516.0 | 14,276.0 | 27,494.4 | 34,505.5 | 43,304.5 | 54,347.3 | 68,205.9 |
| Depreciation | ||||||||||
| Changes in Account Receivables | ||||||||||
| Changes in Inventories | ||||||||||
| Changes in Accounts Payable | ||||||||||
| Capital Expenditure | ||||||||||
| UFCF | 67,323.0 | 38,451.0 | 43,247.0 | -21,811.0 | 4,468.0 | -48,247.5 | 29,862.1 | 37,477.0 | 47,033.8 | 59,027.5 |
| WACC, % | 9.34 | 9.69 | 9.98 | 9.63 | 9.49 | 9.63 | 9.63 | 9.63 | 9.63 | 9.63 |
| PV UFCF | ||||||||||
| SUM PV UFCF | 79,124.8 | |||||||||
| Long Term Growth Rate, % | 2.00 | |||||||||
| Free cash flow (T + 1) | 60,208 | |||||||||
| Terminal Value | 789,375 | |||||||||
| Present Terminal Value | 498,528 | |||||||||
| Enterprise Value | 577,653 | |||||||||
| Net Debt | 434,843 | |||||||||
| Equity Value | 142,810 | |||||||||
| Diluted Shares Outstanding, MM | 334 | |||||||||
| Equity Value Per Share | 428.09 |
What You Will Get
- Pre-Filled Financial Model: Goldman Sachs' actual data enables precise DCF valuation.
- Full Forecast Control: Adjust revenue growth, margins, WACC, and other key drivers.
- Instant Calculations: Automatic updates ensure you see results as you make changes.
- Investor-Ready Template: A refined Excel file designed for professional-grade valuation.
- Customizable and Reusable: Tailored for flexibility, allowing repeated use for detailed forecasts.
Key Features
- Comprehensive Financial Data: Goldman Sachs' historical financial statements and projected forecasts.
- Customizable Parameters: Modify WACC, tax rates, revenue growth, and EBITDA margins to fit your analysis.
- Real-Time Valuation: Observe Goldman Sachs' intrinsic value update instantly.
- Intuitive Visualizations: Dashboard graphs present valuation outcomes and essential metrics clearly.
- Designed for Precision: A sophisticated tool tailored for analysts, investors, and financial professionals.
How It Works
- Download the Template: Gain immediate access to the Excel-based GS DCF Calculator.
- Input Your Assumptions: Modify the yellow-highlighted cells for growth rates, WACC, margins, and other variables.
- Instant Calculations: The model will automatically refresh Goldman Sachs’ intrinsic value.
- Test Scenarios: Experiment with various assumptions to assess potential changes in valuation.
- Analyze and Decide: Leverage the results to inform your investment or financial analysis.
Why Choose Goldman Sachs Group, Inc. (GS)?
- Expert Insights: Access to top-tier financial analysis and market research.
- Global Reach: Benefit from a vast network and resources across various markets.
- Innovative Solutions: Cutting-edge tools and strategies tailored to your financial needs.
- Commitment to Excellence: A proven track record of delivering reliable and effective financial services.
- Client-Centric Approach: Focused on understanding and meeting your unique financial objectives.
Who Should Use This Product?
- Investors: Evaluate Goldman Sachs’ valuation before making investment decisions.
- CFOs and Financial Analysts: Enhance valuation methodologies and assess financial forecasts.
- Startup Founders: Understand how leading financial institutions like Goldman Sachs are appraised.
- Consultants: Provide comprehensive valuation analyses for clients in need.
- Students and Educators: Utilize real-time data to learn and teach valuation strategies.
What the Template Contains
- Pre-Filled DCF Model: The Goldman Sachs Group, Inc.’s (GS) financial data preloaded for immediate use.
- WACC Calculator: Detailed calculations for Weighted Average Cost of Capital.
- Financial Ratios: Evaluate The Goldman Sachs Group, Inc.’s (GS) profitability, leverage, and efficiency.
- Editable Inputs: Change assumptions such as growth, margins, and CAPEX to fit your scenarios.
- Financial Statements: Annual and quarterly reports to support detailed analysis.
- Interactive Dashboard: Easily visualize key valuation metrics and results.
Disclaimer
All information, articles, and product details provided on this website are for general informational and educational purposes only. We do not claim any ownership over, nor do we intend to infringe upon, any trademarks, copyrights, logos, brand names, or other intellectual property mentioned or depicted on this site. Such intellectual property remains the property of its respective owners, and any references here are made solely for identification or informational purposes, without implying any affiliation, endorsement, or partnership.
We make no representations or warranties, express or implied, regarding the accuracy, completeness, or suitability of any content or products presented. Nothing on this website should be construed as legal, tax, investment, financial, medical, or other professional advice. In addition, no part of this site—including articles or product references—constitutes a solicitation, recommendation, endorsement, advertisement, or offer to buy or sell any securities, franchises, or other financial instruments, particularly in jurisdictions where such activity would be unlawful.
All content is of a general nature and may not address the specific circumstances of any individual or entity. It is not a substitute for professional advice or services. Any actions you take based on the information provided here are strictly at your own risk. You accept full responsibility for any decisions or outcomes arising from your use of this website and agree to release us from any liability in connection with your use of, or reliance upon, the content or products found herein.