
|
شركة كروجر (KR) تقييم DCF |
Fully Editable: Tailor To Your Needs In Excel Or Sheets
Professional Design: Trusted, Industry-Standard Templates
Investor-Approved Valuation Models
MAC/PC Compatible, Fully Unlocked
No Expertise Is Needed; Easy To Follow
The Kroger Co. (KR) Bundle
هل تبحث لتقييم القيمة الجوهرية لشركة Kroger؟ يدمج حاسبة (KR) DCF بيانات العالم الحقيقي مع خيارات تخصيص شاملة ، مما يتيح لك تحسين تنبؤاتك وتعزيز استراتيجيات الاستثمار الخاصة بك.
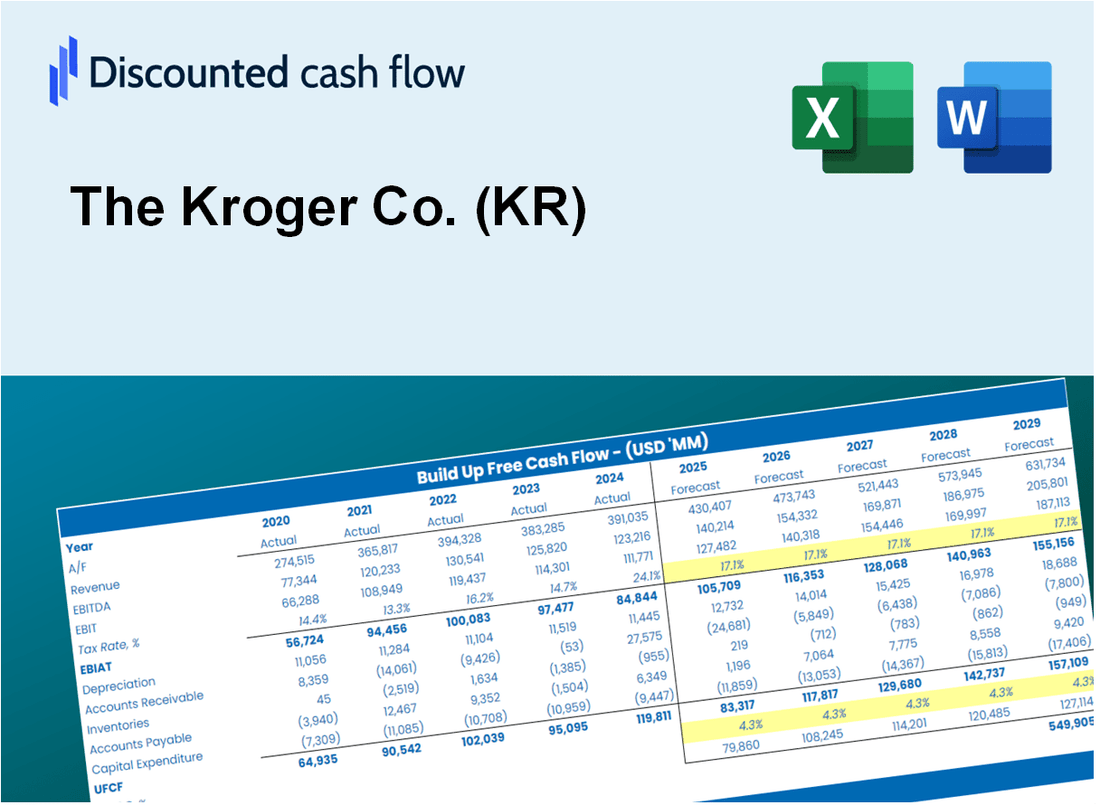
Discounted Cash Flow (DCF) - (USD MM)
| Year | AY1 2020 |
AY2 2021 |
AY3 2022 |
AY4 2023 |
AY5 2024 |
FY1 2025 |
FY2 2026 |
FY3 2027 |
FY4 2028 |
FY5 2029 |
|---|---|---|---|---|---|---|---|---|---|---|
| Revenue | 132,498.0 | 137,888.0 | 148,258.0 | 150,039.0 | 147,123.0 | 151,112.4 | 155,209.9 | 159,418.6 | 163,741.4 | 168,181.4 |
| Revenue Growth, % | 0 | 4.07 | 7.52 | 1.2 | -1.94 | 2.71 | 2.71 | 2.71 | 2.71 | 2.71 |
| EBITDA | 7,291.0 | 6,061.0 | 7,025.0 | 7,035.0 | 7,650.0 | 7,412.1 | 7,613.1 | 7,819.5 | 8,031.6 | 8,249.4 |
| EBITDA, % | 5.5 | 4.4 | 4.74 | 4.69 | 5.2 | 4.91 | 4.91 | 4.91 | 4.91 | 4.91 |
| Depreciation | 3,373.0 | 3,429.0 | 3,579.0 | 3,750.0 | 3,849.0 | 3,796.6 | 3,899.5 | 4,005.3 | 4,113.9 | 4,225.4 |
| Depreciation, % | 2.55 | 2.49 | 2.41 | 2.5 | 2.62 | 2.51 | 2.51 | 2.51 | 2.51 | 2.51 |
| EBIT | 3,918.0 | 2,632.0 | 3,446.0 | 3,285.0 | 3,801.0 | 3,615.6 | 3,713.6 | 3,814.3 | 3,917.7 | 4,024.0 |
| EBIT, % | 2.96 | 1.91 | 2.32 | 2.19 | 2.58 | 2.39 | 2.39 | 2.39 | 2.39 | 2.39 |
| Total Cash | 2,783.0 | 2,903.0 | 2,142.0 | 3,098.0 | 5,271.0 | 3,414.5 | 3,507.1 | 3,602.2 | 3,699.9 | 3,800.2 |
| Total Cash, percent | .0 | .0 | .0 | .0 | .0 | .0 | .0 | .0 | .0 | .0 |
| Account Receivables | 1,781.0 | 1,828.0 | 2,234.0 | 2,136.0 | 2,195.0 | 2,143.5 | 2,201.6 | 2,261.3 | 2,322.6 | 2,385.6 |
| Account Receivables, % | 1.34 | 1.33 | 1.51 | 1.42 | 1.49 | 1.42 | 1.42 | 1.42 | 1.42 | 1.42 |
| Inventories | 7,063.0 | 6,783.0 | 7,560.0 | 7,105.0 | 7,038.0 | 7,515.8 | 7,719.6 | 7,928.9 | 8,143.9 | 8,364.8 |
| Inventories, % | 5.33 | 4.92 | 5.1 | 4.74 | 4.78 | 4.97 | 4.97 | 4.97 | 4.97 | 4.97 |
| Accounts Payable | 6,679.0 | 7,117.0 | 10,179.0 | 10,381.0 | 10,124.0 | 9,329.1 | 9,582.1 | 9,841.9 | 10,108.8 | 10,382.9 |
| Accounts Payable, % | 5.04 | 5.16 | 6.87 | 6.92 | 6.88 | 6.17 | 6.17 | 6.17 | 6.17 | 6.17 |
| Capital Expenditure | -2,865.0 | -2,614.0 | -3,078.0 | -3,904.0 | -4,017.0 | -3,465.5 | -3,559.4 | -3,655.9 | -3,755.1 | -3,856.9 |
| Capital Expenditure, % | -2.16 | -1.9 | -2.08 | -2.6 | -2.73 | -2.29 | -2.29 | -2.29 | -2.29 | -2.29 |
| Tax Rate, % | 20.26 | 20.26 | 20.26 | 20.26 | 20.26 | 20.26 | 20.26 | 20.26 | 20.26 | 20.26 |
| EBITAT | 3,005.4 | 2,123.8 | 2,664.7 | 2,506.6 | 3,031.0 | 2,825.7 | 2,902.3 | 2,981.0 | 3,061.9 | 3,144.9 |
| Depreciation | ||||||||||
| Changes in Account Receivables | ||||||||||
| Changes in Inventories | ||||||||||
| Changes in Accounts Payable | ||||||||||
| Capital Expenditure | ||||||||||
| UFCF | 1,348.4 | 3,609.8 | 5,044.7 | 3,107.6 | 2,614.0 | 1,935.7 | 3,233.5 | 3,321.1 | 3,411.2 | 3,503.7 |
| WACC, % | 5.08 | 5.13 | 5.09 | 5.08 | 5.12 | 5.1 | 5.1 | 5.1 | 5.1 | 5.1 |
| PV UFCF | ||||||||||
| SUM PV UFCF | 13,156.9 | |||||||||
| Long Term Growth Rate, % | 0.50 | |||||||||
| Free cash flow (T + 1) | 3,521 | |||||||||
| Terminal Value | 76,515 | |||||||||
| Present Terminal Value | 59,661 | |||||||||
| Enterprise Value | 72,818 | |||||||||
| Net Debt | 21,123 | |||||||||
| Equity Value | 51,695 | |||||||||
| Diluted Shares Outstanding, MM | 720 | |||||||||
| Equity Value Per Share | 71.80 |
What You Will Get
- Editable Forecast Inputs: Easily modify assumptions (growth %, margins, WACC) to explore various scenarios.
- Real-World Data: Kroger’s financial data pre-filled to accelerate your analysis.
- Automatic DCF Outputs: The template computes Net Present Value (NPV) and intrinsic value automatically.
- Customizable and Professional: A refined Excel model tailored to meet your valuation requirements.
- Built for Analysts and Investors: Perfect for evaluating projections, confirming strategies, and enhancing efficiency.
Key Features
- Real-Life KR Data: Pre-filled with Kroger's historical financials and future projections.
- Fully Customizable Inputs: Modify revenue growth, profit margins, WACC, tax rates, and capital expenditures.
- Dynamic Valuation Model: Automatic updates to Net Present Value (NPV) and intrinsic value based on your adjustments.
- Scenario Testing: Develop multiple forecasting scenarios to evaluate various valuation outcomes.
- User-Friendly Design: Intuitive, organized, and crafted for both professionals and novices.
How It Works
- Step 1: Download the Excel file.
- Step 2: Review Kroger’s pre-filled financial data and forecasts.
- Step 3: Modify key inputs such as revenue growth, WACC, and tax rates (highlighted cells).
- Step 4: Observe the DCF model update in real-time as you adjust your assumptions.
- Step 5: Evaluate the outputs and leverage the results for your investment strategies.
Why Choose Kroger's Services?
- Save Time: No need to search for groceries – everything you need is just a click away.
- Enhance Convenience: Streamlined shopping experience with easy online ordering and delivery options.
- Fully Customizable: Personalize your shopping list to reflect your preferences and dietary needs.
- User-Friendly Interface: Intuitive design makes navigating our services effortless.
- Trusted by Customers: A reliable choice for families and individuals who prioritize quality and service.
Who Should Use This Product?
- Investors: Assess Kroger’s valuation before making stock transactions.
- CFOs and Financial Analysts: Optimize valuation methods and evaluate financial forecasts.
- Startup Founders: Understand the valuation strategies of leading grocery chains like Kroger.
- Consultants: Provide detailed valuation reports for clients in the retail sector.
- Students and Educators: Utilize current data to practice and teach valuation methodologies.
What the Template Contains
- Preloaded KR Data: Historical and projected financial data, including revenue, EBIT, and capital expenditures.
- DCF and WACC Models: Professional-grade sheets for calculating intrinsic value and Weighted Average Cost of Capital.
- Editable Inputs: Yellow-highlighted cells for adjusting revenue growth, tax rates, and discount rates.
- Financial Statements: Comprehensive annual and quarterly financials for deeper analysis.
- Key Ratios: Profitability, leverage, and efficiency ratios to evaluate performance.
- Dashboard and Charts: Visual summaries of valuation outcomes and assumptions.
Disclaimer
All information, articles, and product details provided on this website are for general informational and educational purposes only. We do not claim any ownership over, nor do we intend to infringe upon, any trademarks, copyrights, logos, brand names, or other intellectual property mentioned or depicted on this site. Such intellectual property remains the property of its respective owners, and any references here are made solely for identification or informational purposes, without implying any affiliation, endorsement, or partnership.
We make no representations or warranties, express or implied, regarding the accuracy, completeness, or suitability of any content or products presented. Nothing on this website should be construed as legal, tax, investment, financial, medical, or other professional advice. In addition, no part of this site—including articles or product references—constitutes a solicitation, recommendation, endorsement, advertisement, or offer to buy or sell any securities, franchises, or other financial instruments, particularly in jurisdictions where such activity would be unlawful.
All content is of a general nature and may not address the specific circumstances of any individual or entity. It is not a substitute for professional advice or services. Any actions you take based on the information provided here are strictly at your own risk. You accept full responsibility for any decisions or outcomes arising from your use of this website and agree to release us from any liability in connection with your use of, or reliance upon, the content or products found herein.