
|
جيه دبليو Mays ، Inc. (Mays) DCF تقييم |
Fully Editable: Tailor To Your Needs In Excel Or Sheets
Professional Design: Trusted, Industry-Standard Templates
Investor-Approved Valuation Models
MAC/PC Compatible, Fully Unlocked
No Expertise Is Needed; Easy To Follow
J.W. Mays, Inc. (MAYS) Bundle
استكشاف الآفاق المالية لـ J.W. Mays ، Inc. (MAYS) مع حاسبة DCF سهلة الاستخدام لدينا! أدخل افتراضاتك المتعلقة بالنمو والهوامش والتكاليف لتحديد القيمة الجوهرية لـ J.W. Mays ، Inc. (MAYS) وصقل استراتيجيتك الاستثمارية.
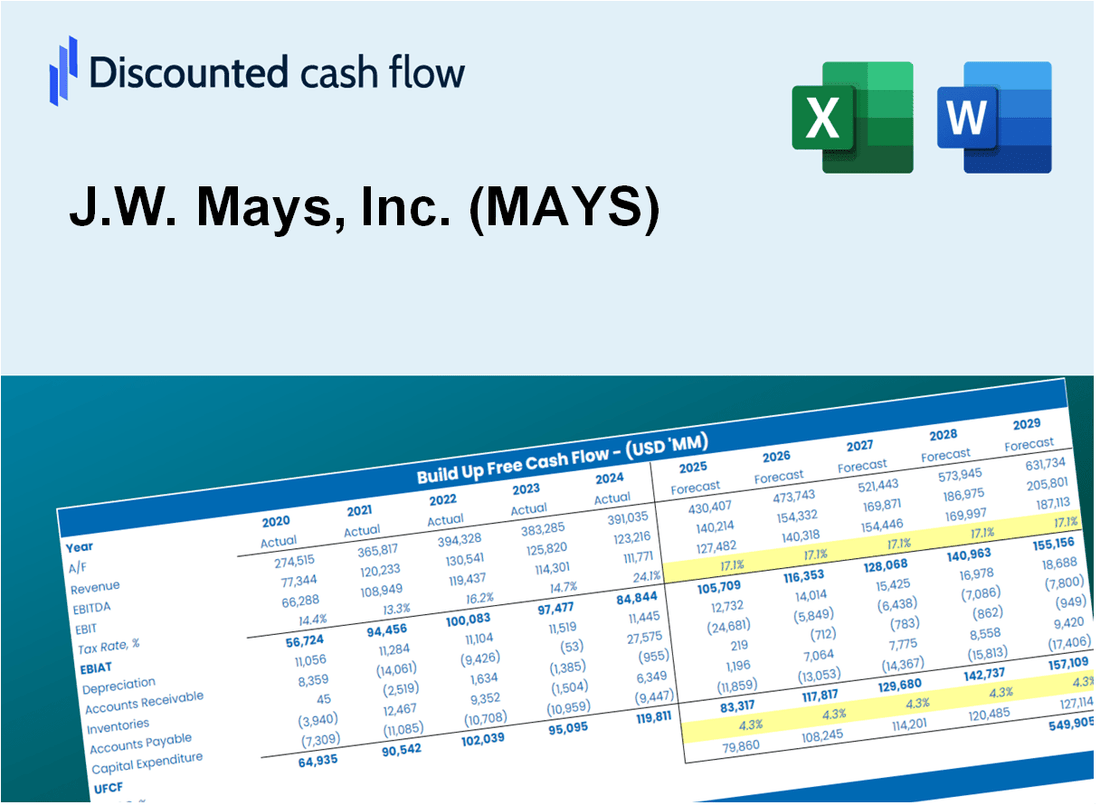
Discounted Cash Flow (DCF) - (USD MM)
| Year | AY1 2021 |
AY2 2022 |
AY3 2023 |
AY4 2024 |
AY5 2025 |
FY1 2026 |
FY2 2027 |
FY3 2028 |
FY4 2029 |
FY5 2030 |
|---|---|---|---|---|---|---|---|---|---|---|
| Revenue | 20.2 | 21.4 | 22.6 | 21.6 | 22.5 | 23.1 | 23.7 | 24.4 | 25.1 | 25.8 |
| Revenue Growth, % | 0 | 5.85 | 5.52 | -4.35 | 4.06 | 2.77 | 2.77 | 2.77 | 2.77 | 2.77 |
| EBITDA | .9 | 1.0 | 2.4 | 1.3 | 2.2 | 1.6 | 1.7 | 1.7 | 1.8 | 1.8 |
| EBITDA, % | 4.69 | 4.64 | 10.48 | 6.1 | 9.58 | 7.1 | 7.1 | 7.1 | 7.1 | 7.1 |
| Depreciation | 21.1 | 22.1 | 22.4 | 1.7 | 2.3 | 14.7 | 15.1 | 15.5 | 15.9 | 16.3 |
| Depreciation, % | 104.14 | 103.07 | 99.01 | 7.99 | 10.26 | 63.45 | 63.45 | 63.45 | 63.45 | 63.45 |
| EBIT | -20.1 | -21.1 | -20.0 | -.4 | -.2 | -13.3 | -13.7 | -14.1 | -14.5 | -14.9 |
| EBIT, % | -99.45 | -98.43 | -88.53 | -1.89 | -0.68684 | -57.8 | -57.8 | -57.8 | -57.8 | -57.8 |
| Total Cash | 5.5 | 3.8 | 3.5 | 1.2 | 1.8 | 3.4 | 3.5 | 3.6 | 3.7 | 3.8 |
| Total Cash, percent | .0 | .0 | .0 | .0 | .0 | .0 | .0 | .0 | .0 | .0 |
| Account Receivables | 2.4 | 2.8 | 3.0 | 3.6 | 4.0 | 3.4 | 3.4 | 3.5 | 3.6 | 3.7 |
| Account Receivables, % | 11.96 | 12.95 | 13.48 | 16.59 | 17.62 | 14.52 | 14.52 | 14.52 | 14.52 | 14.52 |
| Inventories | .0 | .0 | .0 | .0 | .0 | .0 | .0 | .0 | .0 | .0 |
| Inventories, % | 0 | 0 | 0 | 0 | 0 | 0 | 0 | 0 | 0 | 0 |
| Accounts Payable | 2.6 | 2.3 | 1.7 | 2.3 | .0 | 1.9 | 2.0 | 2.0 | 2.1 | 2.2 |
| Accounts Payable, % | 13.03 | 10.85 | 7.61 | 10.52 | 0 | 8.4 | 8.4 | 8.4 | 8.4 | 8.4 |
| Capital Expenditure | -2.3 | -1.7 | -1.0 | -2.5 | -2.4 | -2.1 | -2.2 | -2.2 | -2.3 | -2.4 |
| Capital Expenditure, % | -11.15 | -8.1 | -4.63 | -11.5 | -10.65 | -9.21 | -9.21 | -9.21 | -9.21 | -9.21 |
| Tax Rate, % | 30.22 | 30.22 | 30.22 | 30.22 | 30.22 | 30.22 | 30.22 | 30.22 | 30.22 | 30.22 |
| EBITAT | -33.5 | -15.0 | -11.4 | -.3 | -.1 | -10.0 | -10.2 | -10.5 | -10.8 | -11.1 |
| Depreciation | ||||||||||
| Changes in Account Receivables | ||||||||||
| Changes in Inventories | ||||||||||
| Changes in Accounts Payable | ||||||||||
| Capital Expenditure | ||||||||||
| UFCF | -14.5 | 4.7 | 9.0 | -1.0 | -2.8 | 5.1 | 2.6 | 2.7 | 2.8 | 2.8 |
| WACC, % | 4.44 | 4.16 | 4.03 | 4.2 | 4.15 | 4.2 | 4.2 | 4.2 | 4.2 | 4.2 |
| PV UFCF | ||||||||||
| SUM PV UFCF | 14.3 | |||||||||
| Long Term Growth Rate, % | 3.00 | |||||||||
| Free cash flow (T + 1) | 3 | |||||||||
| Terminal Value | 243 | |||||||||
| Present Terminal Value | 198 | |||||||||
| Enterprise Value | 212 | |||||||||
| Net Debt | 26 | |||||||||
| Equity Value | 187 | |||||||||
| Diluted Shares Outstanding, MM | 2 | |||||||||
| Equity Value Per Share | 92.69 |
What You Will Get
- Real J.W. Mays, Inc. Data: Preloaded financials – from revenue to EBIT – based on actual and projected figures for J.W. Mays, Inc. (MAYS).
- Full Customization: Adjust all critical parameters (yellow cells) like WACC, growth %, and tax rates to fit J.W. Mays, Inc. (MAYS).
- Instant Valuation Updates: Automatic recalculations to analyze the impact of changes on J.W. Mays, Inc. (MAYS) fair value.
- Versatile Excel Template: Tailored for quick edits, scenario testing, and detailed projections specifically for J.W. Mays, Inc. (MAYS).
- Time-Saving and Accurate: Skip building models from scratch while maintaining precision and flexibility for J.W. Mays, Inc. (MAYS).
Key Features
- Accurate Financial Data: Gain access to reliable historical data and future outlooks for J.W. Mays, Inc. (MAYS).
- Adjustable Financial Assumptions: Modify highlighted cells for key metrics such as WACC, growth rates, and profit margins.
- Real-Time Calculations: Enjoy automatic updates for DCF, Net Present Value (NPV), and cash flow assessments.
- User-Friendly Dashboard: View intuitive charts and summaries to better understand your valuation outcomes.
- Designed for All Skill Levels: An accessible and straightforward layout tailored for investors, CFOs, and consultants alike.
How It Works
- Download the Template: Gain immediate access to the Excel-based J.W. Mays, Inc. DCF Calculator.
- Input Your Assumptions: Modify the yellow-highlighted cells for growth rates, WACC, margins, and more.
- Instant Calculations: The model automatically updates J.W. Mays, Inc.'s intrinsic value.
- Test Scenarios: Experiment with different assumptions to assess potential valuation changes.
- Analyze and Decide: Utilize the results to inform your investment or financial analysis.
Why Choose J.W. Mays, Inc. (MAYS) Calculator?
- Accuracy: Utilizes verified financial data for reliable calculations.
- Flexibility: Allows users to easily adjust and experiment with various inputs.
- Time-Saving: Eliminate the need to create a financial model from the ground up.
- Professional-Grade: Crafted with the expertise and precision expected from industry leaders.
- User-Friendly: Intuitive design makes it accessible for users with any level of financial knowledge.
Who Should Use J.W. Mays, Inc. (MAYS)?
- Real Estate Students: Understand property valuation methods and apply them to real-world scenarios.
- Researchers: Integrate industry-specific models into your academic projects or studies.
- Investors: Evaluate your investment strategies and analyze the performance of J.W. Mays, Inc. (MAYS).
- Financial Analysts: Enhance your analysis with a ready-to-use, customizable financial model.
- Entrepreneurs: Learn how established companies like J.W. Mays, Inc. (MAYS) are assessed in the market.
What the Template Contains
- Historical Data: Includes J.W. Mays, Inc.'s (MAYS) past financials and baseline forecasts.
- DCF and Levered DCF Models: Detailed templates to calculate J.W. Mays, Inc.'s (MAYS) intrinsic value.
- WACC Sheet: Pre-built calculations for Weighted Average Cost of Capital.
- Editable Inputs: Modify key drivers like growth rates, EBITDA %, and CAPEX assumptions.
- Quarterly and Annual Statements: A complete breakdown of J.W. Mays, Inc.'s (MAYS) financials.
- Interactive Dashboard: Visualize valuation results and projections dynamically.
Disclaimer
All information, articles, and product details provided on this website are for general informational and educational purposes only. We do not claim any ownership over, nor do we intend to infringe upon, any trademarks, copyrights, logos, brand names, or other intellectual property mentioned or depicted on this site. Such intellectual property remains the property of its respective owners, and any references here are made solely for identification or informational purposes, without implying any affiliation, endorsement, or partnership.
We make no representations or warranties, express or implied, regarding the accuracy, completeness, or suitability of any content or products presented. Nothing on this website should be construed as legal, tax, investment, financial, medical, or other professional advice. In addition, no part of this site—including articles or product references—constitutes a solicitation, recommendation, endorsement, advertisement, or offer to buy or sell any securities, franchises, or other financial instruments, particularly in jurisdictions where such activity would be unlawful.
All content is of a general nature and may not address the specific circumstances of any individual or entity. It is not a substitute for professional advice or services. Any actions you take based on the information provided here are strictly at your own risk. You accept full responsibility for any decisions or outcomes arising from your use of this website and agree to release us from any liability in connection with your use of, or reliance upon, the content or products found herein.