
|
New England Realty Associates Limited Partnership (NEN) DCF تقييم |
Fully Editable: Tailor To Your Needs In Excel Or Sheets
Professional Design: Trusted, Industry-Standard Templates
Investor-Approved Valuation Models
MAC/PC Compatible, Fully Unlocked
No Expertise Is Needed; Easy To Follow
New England Realty Associates Limited Partnership (NEN) Bundle
تقييم الآفاق المالية لشراكة New England Realty Associates Limited (NEN) بدقة الخبراء! توفر حاسبة DCF (NEN) هذه البيانات المالية المكتظة مسبقًا وتتيح لك تعديل نمو الإيرادات ، و WACC ، وهامش الربح ، وغيرها من الافتراضات الحرجة التي تتماشى مع توقعاتك.
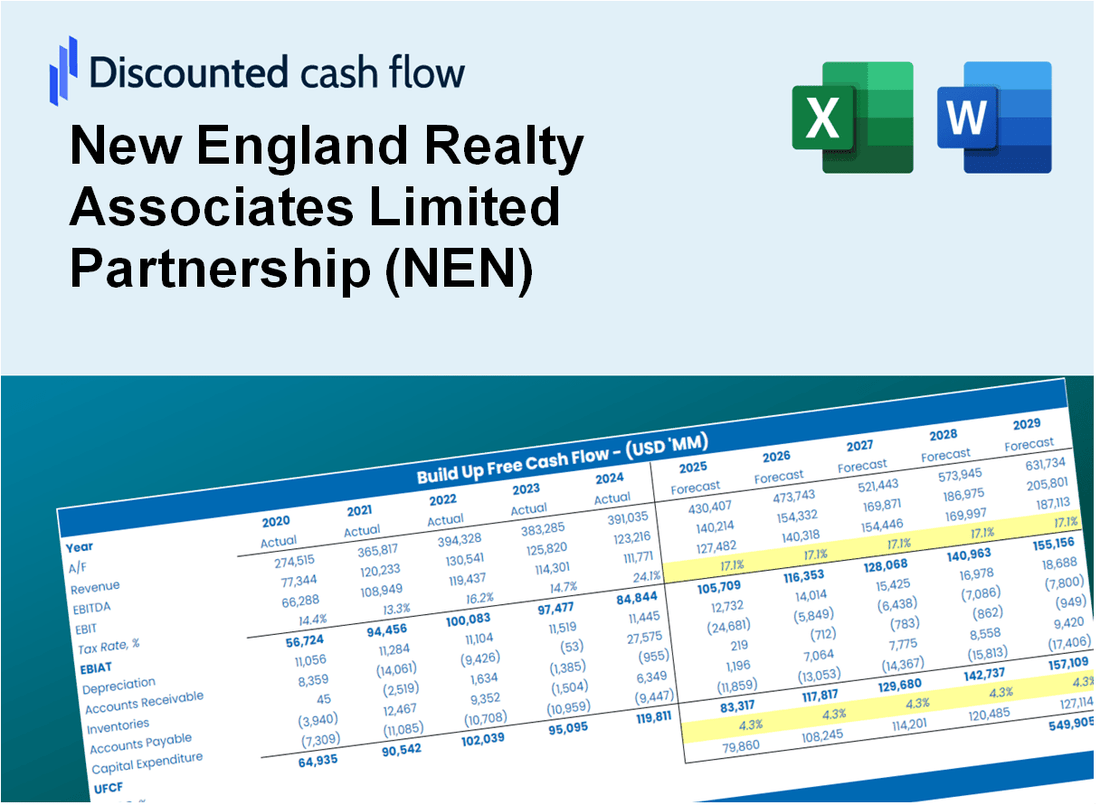
Discounted Cash Flow (DCF) - (USD MM)
| Year | AY1 2020 |
AY2 2021 |
AY3 2022 |
AY4 2023 |
AY5 2024 |
FY1 2025 |
FY2 2026 |
FY3 2027 |
FY4 2028 |
FY5 2029 |
|---|---|---|---|---|---|---|---|---|---|---|
| Revenue | 62.1 | 62.6 | 68.3 | 74.5 | 80.5 | 86.0 | 91.8 | 98.0 | 104.7 | 111.7 |
| Revenue Growth, % | 0 | 0.86267 | 9.03 | 9.06 | 8.12 | 6.77 | 6.77 | 6.77 | 6.77 | 6.77 |
| EBITDA | 33.5 | 30.9 | 34.5 | 36.6 | 48.1 | 45.2 | 48.2 | 51.5 | 55.0 | 58.7 |
| EBITDA, % | 54.01 | 49.35 | 50.46 | 49.08 | 59.73 | 52.53 | 52.53 | 52.53 | 52.53 | 52.53 |
| Depreciation | 18.4 | 16.7 | 16.4 | 16.8 | 17.0 | 21.3 | 22.7 | 24.3 | 25.9 | 27.7 |
| Depreciation, % | 29.65 | 26.61 | 23.98 | 22.52 | 21.09 | 24.77 | 24.77 | 24.77 | 24.77 | 24.77 |
| EBIT | 15.1 | 14.2 | 18.1 | 19.8 | 31.1 | 23.9 | 25.5 | 27.2 | 29.1 | 31.0 |
| EBIT, % | 24.36 | 22.74 | 26.49 | 26.56 | 38.64 | 27.76 | 27.76 | 27.76 | 27.76 | 27.76 |
| Total Cash | 18.6 | 96.1 | 137.9 | 102.9 | 101.2 | 74.0 | 79.0 | 84.3 | 90.0 | 96.1 |
| Total Cash, percent | .0 | .0 | .0 | .0 | .0 | .0 | .0 | .0 | .0 | .0 |
| Account Receivables | 1.9 | 1.8 | 2.6 | 3.2 | 3.8 | 3.2 | 3.5 | 3.7 | 3.9 | 4.2 |
| Account Receivables, % | 3.14 | 2.87 | 3.81 | 4.27 | 4.74 | 3.77 | 3.77 | 3.77 | 3.77 | 3.77 |
| Inventories | .0 | .0 | .0 | .0 | .0 | .0 | .0 | .0 | .0 | .0 |
| Inventories, % | 0 | 0 | 0 | 0 | 0 | 0 | 0 | 0 | 0 | 0 |
| Accounts Payable | 3.9 | 4.3 | 7.3 | 5.7 | 9.0 | 7.3 | 7.8 | 8.4 | 8.9 | 9.5 |
| Accounts Payable, % | 6.26 | 6.9 | 10.65 | 7.68 | 11.18 | 8.53 | 8.53 | 8.53 | 8.53 | 8.53 |
| Capital Expenditure | -3.2 | -3.3 | -6.0 | .0 | .0 | -3.3 | -3.5 | -3.8 | -4.0 | -4.3 |
| Capital Expenditure, % | -5.22 | -5.3 | -8.76 | 0.000005370471 | 0 | -3.85 | -3.85 | -3.85 | -3.85 | -3.85 |
| Tax Rate, % | 0 | 0 | 0 | 0 | 0 | 0 | 0 | 0 | 0 | 0 |
| EBITAT | 15.1 | 14.2 | 18.1 | 19.8 | 31.1 | 23.9 | 25.5 | 27.2 | 29.1 | 31.0 |
| Depreciation | ||||||||||
| Changes in Account Receivables | ||||||||||
| Changes in Inventories | ||||||||||
| Changes in Accounts Payable | ||||||||||
| Capital Expenditure | ||||||||||
| UFCF | 32.2 | 28.2 | 30.6 | 34.4 | 50.8 | 40.8 | 45.0 | 48.0 | 51.3 | 54.7 |
| WACC, % | 4.14 | 4.14 | 4.14 | 4.14 | 4.14 | 4.14 | 4.14 | 4.14 | 4.14 | 4.14 |
| PV UFCF | ||||||||||
| SUM PV UFCF | 211.4 | |||||||||
| Long Term Growth Rate, % | 3.00 | |||||||||
| Free cash flow (T + 1) | 56 | |||||||||
| Terminal Value | 4,963 | |||||||||
| Present Terminal Value | 4,052 | |||||||||
| Enterprise Value | 4,264 | |||||||||
| Net Debt | 389 | |||||||||
| Equity Value | 3,875 | |||||||||
| Diluted Shares Outstanding, MM | 4 | |||||||||
| Equity Value Per Share | 1,093.92 |
What You Will Receive
- Comprehensive Financial Model: Utilize New England Realty Associates Limited Partnership’s (NEN) actual data for accurate DCF valuation.
- Complete Forecast Flexibility: Modify revenue growth, profit margins, WACC, and other essential variables.
- Real-Time Calculations: Automatic updates provide immediate feedback as you adjust inputs.
- Professional-Grade Template: An expertly crafted Excel file ready for high-level valuation presentations.
- Adaptable and Reusable: Designed for versatility, enabling repeated applications for in-depth forecasts.
Key Features
- Comprehensive NEN Data: Pre-filled with New England Realty Associates Limited Partnership’s historical performance and future projections.
- Customizable Financial Inputs: Modify revenue growth, operating expenses, capital structure, and tax assumptions.
- Interactive Valuation Model: Real-time updates to Net Present Value (NPV) and intrinsic value based on your adjustments.
- Scenario Analysis: Develop various forecasting scenarios to assess different valuation possibilities.
- User-Centric Interface: Intuitive, organized, and crafted for both industry professionals and newcomers.
How It Works
- Step 1: Download the Excel file.
- Step 2: Review pre-entered New England Realty Associates Limited Partnership (NEN) data (historical and projected).
- Step 3: Adjust key assumptions (yellow cells) based on your analysis.
- Step 4: View automatic recalculations for New England Realty Associates Limited Partnership's intrinsic value.
- Step 5: Use the outputs for investment decisions or reporting.
Why Choose New England Realty Associates Limited Partnership (NEN)?
- Streamlined Process: Skip the hassle of building real estate models from the ground up – our tools are ready for immediate use.
- Enhanced Precision: Access to reliable market data and formulas minimizes valuation discrepancies.
- Completely Adaptable: Modify the models to align with your unique assumptions and forecasts.
- User-Friendly Insights: Intuitive charts and outputs facilitate straightforward analysis of results.
- Endorsed by Professionals: Crafted for industry experts who prioritize accuracy and practicality.
Who Should Use This Product?
- Real Estate Investors: Assess New England Realty Associates Limited Partnership’s (NEN) market performance before making investment decisions.
- Property Managers and Analysts: Optimize property valuation processes and evaluate market trends.
- Real Estate Developers: Understand how established firms like New England Realty Associates (NEN) are valued in the market.
- Consultants: Prepare detailed valuation reports for clients in the real estate sector.
- Students and Educators: Utilize real estate data to learn and teach valuation methodologies.
What the Template Contains
- Pre-Filled Data: Contains New England Realty Associates Limited Partnership’s historical financials and forecasts.
- Discounted Cash Flow Model: Editable DCF valuation model with automatic calculations tailored for (NEN).
- Weighted Average Cost of Capital (WACC): A dedicated sheet for calculating WACC based on custom inputs specific to (NEN).
- Key Financial Ratios: Analyze (NEN)’s profitability, efficiency, and leverage metrics.
- Customizable Inputs: Easily edit revenue growth, margins, and tax rates for (NEN).
- Clear Dashboard: Visuals and tables summarizing key valuation results for (NEN).
Disclaimer
All information, articles, and product details provided on this website are for general informational and educational purposes only. We do not claim any ownership over, nor do we intend to infringe upon, any trademarks, copyrights, logos, brand names, or other intellectual property mentioned or depicted on this site. Such intellectual property remains the property of its respective owners, and any references here are made solely for identification or informational purposes, without implying any affiliation, endorsement, or partnership.
We make no representations or warranties, express or implied, regarding the accuracy, completeness, or suitability of any content or products presented. Nothing on this website should be construed as legal, tax, investment, financial, medical, or other professional advice. In addition, no part of this site—including articles or product references—constitutes a solicitation, recommendation, endorsement, advertisement, or offer to buy or sell any securities, franchises, or other financial instruments, particularly in jurisdictions where such activity would be unlawful.
All content is of a general nature and may not address the specific circumstances of any individual or entity. It is not a substitute for professional advice or services. Any actions you take based on the information provided here are strictly at your own risk. You accept full responsibility for any decisions or outcomes arising from your use of this website and agree to release us from any liability in connection with your use of, or reliance upon, the content or products found herein.